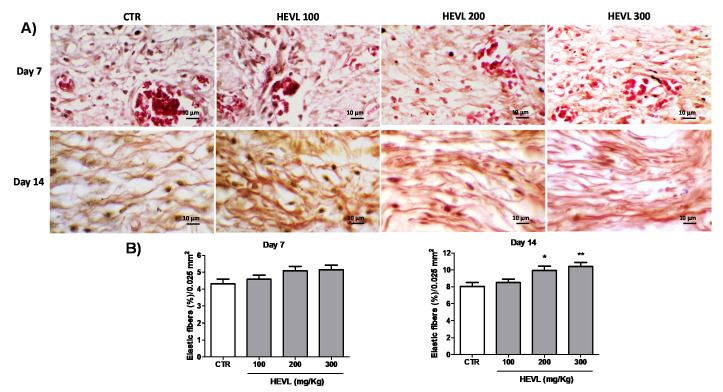
Figure 7.
(A) Photomicrographs representative of the pattern of elastic fibers distribution in the experimental groups. Elastic fibers are identified as short thin delicate dark-stained fibrillary structures that are scarcely seen on day 7 but more noticeable and irregularly organized on day 14 (Weigert stain, 1000×). (B) Assessment of elastic fibers deposition (percentage of collagen fibers content/0.025 mm2) within the healing areas in the experimental groups on days 7 day 14. Data are expressed as mean ± standard error of the mean. Significant differences in comparison with CTR are expressed as * p < 0.05 and ** p < 0.01 (ANOVA and Tukey’s multiple comparisons test).

