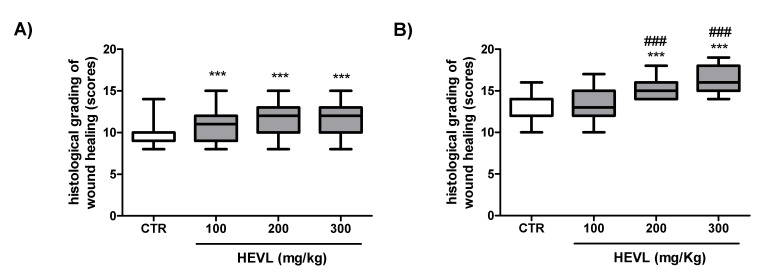
Figure 8.
Assessment of wound healing histological grading scores in the experimental groups on day 7 (A) and 14 (B). Data are expressed as median, interquartile range and maximum and minimum values. Significant differences in relation to the CTR (control) group are expressed as *** p <0.001; and significant differences in comparison with HEVL 100 are expressed as ### p < 0.001 (Kruskal-Wallis test and Dunn’s multiple comparison test).

