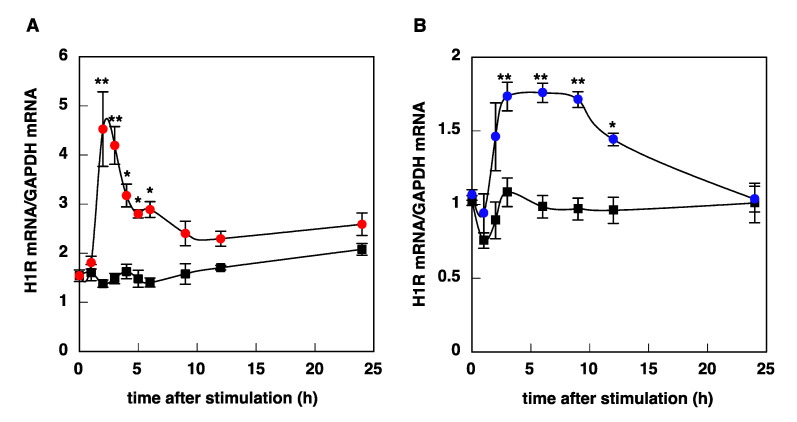
Figure 3.
Time course of histamine-induced upregulation of H1R mRNA in U-373 MG cells (A) and HeLa cells (B). At given time intervals after stimulation with 100 μM (U-373 MG cells) or 10 μM (HeLa cells) histamine, total RNA was isolated, and H1R mRNA was determined by real-time quantitative RT-PCR. Closed circles, histamine; closed squares, control. Data are expressed as means ± SEM (n = 8–12). * p < 0.05 vs. control; ** p < 0.01 vs. control. For statistical analysis, two-way ANOVA with Tukey–Kramer’s test was used.

