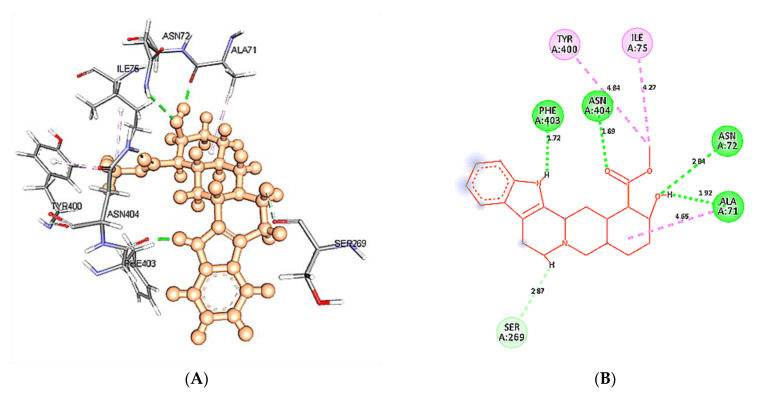
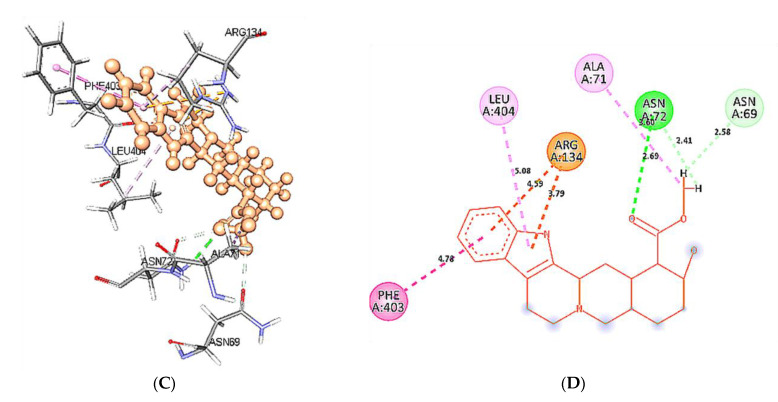
Figure 13.
Intra-molecular interactions formed between docked complexes at 50 ns of MD simulation. (A,B) shows hydrogen bond in dashed line and hydrophobic bonds in pink dashed line, where yohimbine is presented in ball and stick while the interacting residues of wild type 5HT1A are shown in sticks. The figures are prepared in Discovery Studio Client V 20.1, in 3D and 2D formats, respectively. (C,D) shows interaction between mutant 5HT1A and yohimbine in 3D and 2D representations.


