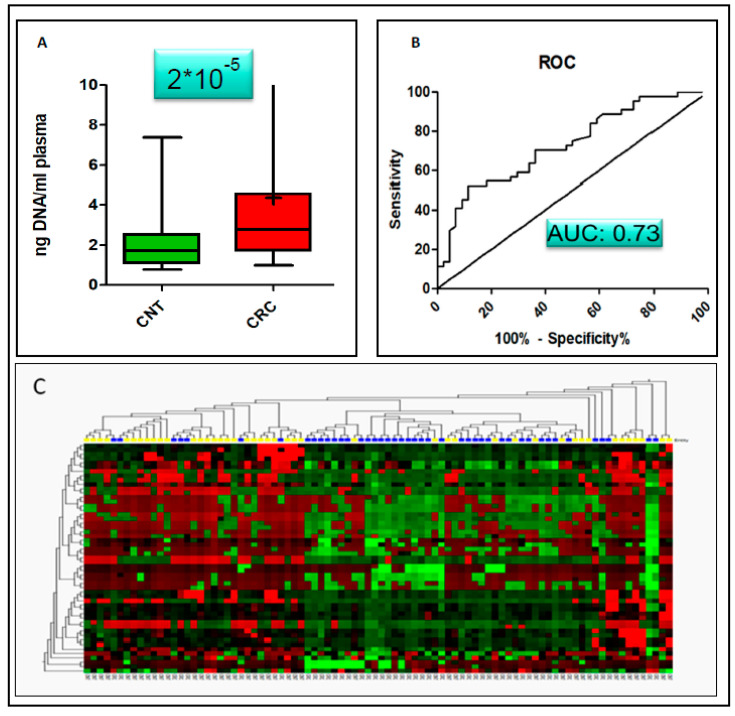
Figure 3.
Diagnostic value of cfDNA yield. Statistical comparison of the isolated amount of cfDNA from CRC and control non-tumour samples (CNT) provided evidence that the amount of isolated cfDNA is a strong indicator for the presence of a tumour. (A): Increased amounts of cfDNA (4.36 +/− 4.82 ng DNA/mL plasma) were found in CRC compared to CNT (2.06 +/− 1.27 ng DNA/mL plasma), which are statistically significant (p = 2 × 10⁻⁵). (B): single AUC value was 0.73. (C): Heatmap with hierarchical clustering for CRC and CNT samples. Two major clusters with prevalence for either CRC or CNT are present. However, 8 CNT and 5 CRC samples did not cluster to the correct group, maybe indicating samples with an intermediate state.

