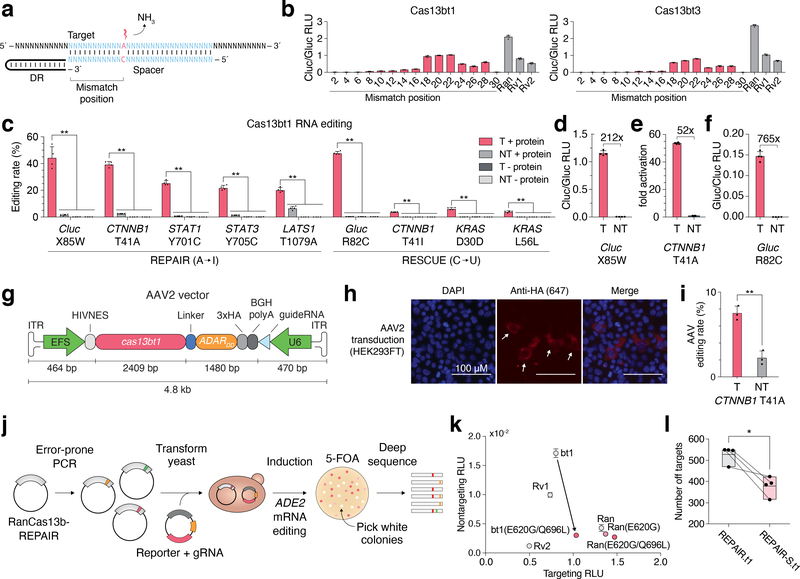
Figure 2 |. RNA editing with Cas13bt.
(A) Schematic of crRNA design for RNA editing. Mismatch at target adenosine shown in red. Mismatch position is measured from the 5´ end of the target.
(B) Evaluation of RNA editing of a W85X Cypridina luciferase reporter in HEK293FT cells. Data are presented as mean ± SD, n = 4 for REPAIR.t1 and n = 3 for REPAIR.t3. Rv1: REPAIRv1; Rv2: REPAIRv22; Ran: RanCas13b-REPAIR3.
(C) Quantification of RNA editing by REPAIR.t1 and RESCUE.t1 by deep sequencing. Statistical significance for interaction of +/– protein and targeting versus non-targeting crRNA was assessed by 2-way ANOVA followed by post-hoc analysis using Games-Howell pairwise comparison. **P < 0.01. For this panel and panels D-F, values show mean ± SD, n = 4, and T: targeting crRNA, NT: Non-targeting crRNA.
(D) Quantification of Cluc restoration by REPAIR.t1.
(E) Quantification of beta-catenin reporter activation of REPAIR.t1.
(F) Quantification of Gluc restoration by RESCUE.t1.
(G) Schematic of AAV2 vector. ITR: inverted terminal repeat; EFS: short Ef1-alpha promoter.
(H) Representative immunofluorescence staining of HEK293FT cells transduced with AAV2 encoding REPAIR.t1 (n = 2).
(I) Quantification of RNA editing of CTNNB1 in HEK293FT cells by AAV2-mediated expression of REPAIR.t1. T: targeting crRNA, NT: Non-targeting crRNA. Data are presented as mean ± SD, n = 3, Statistical significance was assessed with a two-tailed t-test, **P < 0.01.
(J) Schematic of a directed evolution approach for engineering specific ADAR2dd variants.
(K) Evaluation of specificity-enhancing ADAR2dd mutants applied to REPAIR.t1 targeting the W85X mutation in a Cypridina luciferase reporter. bt1: REPAIR.t1; other construct abbreviations are as in (B). Data are presented as mean ± standard deviation of non-targeting RLU, n = 3.
(L) Quantitative comparison of off-target editing between REPAIR.t1 variants. REPAIR-S: ADAR2dd(E488Q/E620G/Q696L); REPAIR: ADAR2dd(E488Q). Data are presented as mean with top and bottom boundaries denoting minimum and maximum, n = 4. Statistical significance was assessed using a two-tailed paired t-test, *P < 0.05. Paired samples are shown by connected lines between the two conditions.
See Table S11 for exact p-values where relevant. SD: standard deviation.

