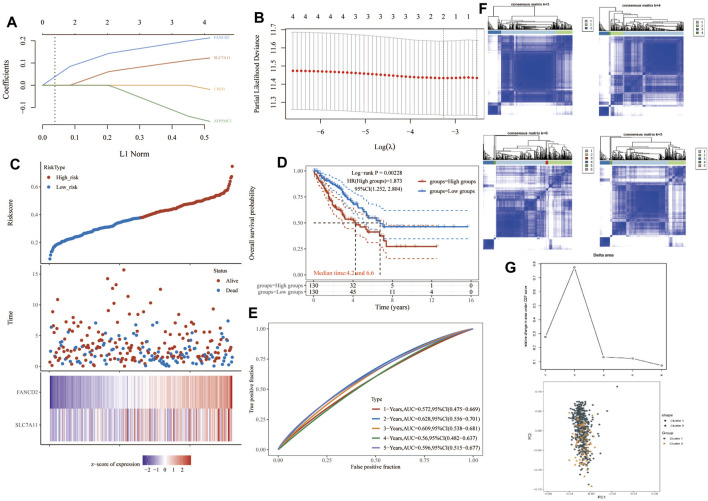
FIGURE 4.
Construction of a prognostic FRG model. (A) LASSO coefficient profiles of the four PRGs. (B) Plots of the ten-fold cross-validation error rates. (C) Distribution of risk score, survival status, and the expression of four prognostic PRGs in SARC. (D,E) Overall survival curves for SARC patients in the high-/low-risk group and the ROC curve of measuring the predictive value. (F,G) Prognostic FRG model. FRG, ferroptosis-related gene; SARC, sarcoma.

