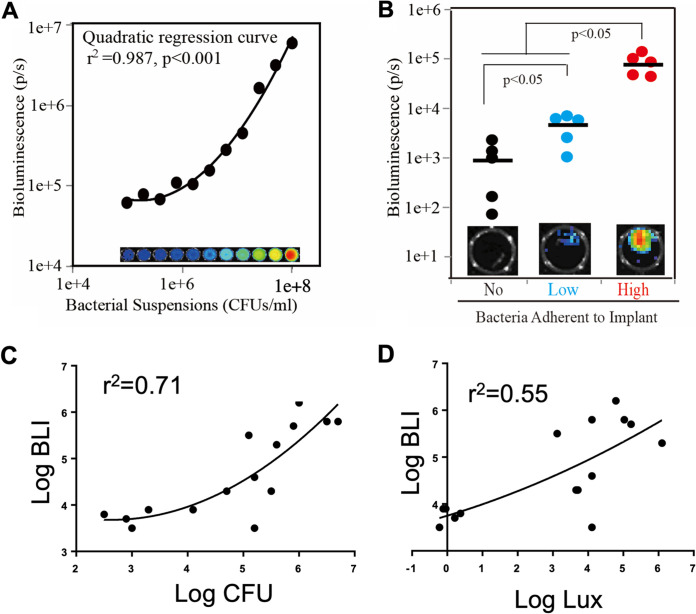
FIG 3.
Bioluminescence imaging (BLI) accurately reflects bacterial number in vitro and in vivo. (A) BLI and CFU were measured in S. aureus suspensions after 2-fold serial dilutions. Statistical analysis was by quadratic regression analysis. Inset shows BLI of bacterial suspensions. (B) BLI was measured on implants without insertion into mice. Statistical analysis was by one-way ANOVA with Bonferroni’s post hoc analysis. Solid horizontal bars indicate means. Inset images are of the implant with BLI closest to the mean. (C and D) BLI was measured in intact mice, and CFU and luxA gene copies were measured on implants and in surrounding femurs at day 7. Statistical analysis was by quadratic regression analysis.

