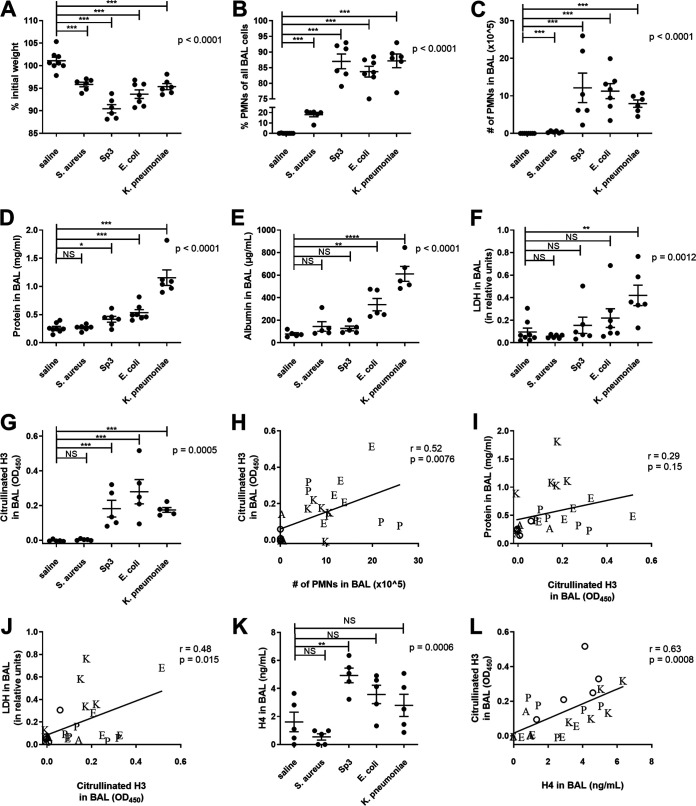
FIG 1.
Comparison of bacterial pneumonias. Mice were infected with 1 to 2 million CFU of Escherichia coli, Streptococcus pneumoniae serotype 3, Staphylococcus aureus, or Klebsiella pneumoniae via IT instillation and sacrificed 24 h later. Mouse weight was recorded prior to IT instillation and at sacrifice, and the percent of original weight was calculated (A). BAL was collected, and the cellular components analyzed for cell count and differential by cytospin to produce the fraction of PMNs (B) and the absolute number of PMNs (C) in the BAL. BAL fluid was then analyzed for total protein (D), albumin (E), LDH (F), citrullinated H3 as a marker of NETs (G), and histone H4 (K). Data shown as individual data points with the mean and standard error represented by solid lines. For all graphs, a one-way ANOVA was performed with P values reported, and Bonferroni’s posttests were performed. For graphs where a Bartlett’s test indicated unequal variances (B to F), the data was log transformed and then analyzed by one-way ANOVA with Bonferroni’s posttests performed. In panels H to J and L, a linear regression was performed, with correlation coefficient and P value reported. Data points are shown as the following letters corresponding to bacteria: A (Staphylococcus aureus), E (Escherichia coli), K (Klebsiella pneumoniae), and P (Streptococcus pneumoniae) or an open circle for saline mice. Data were from two independent experiments that totaled n = 6 to 8 mice per group. NS, not significant; *, P < 0.05; **, P < 0.01; ***, P < 0.001.

