FIG 5.
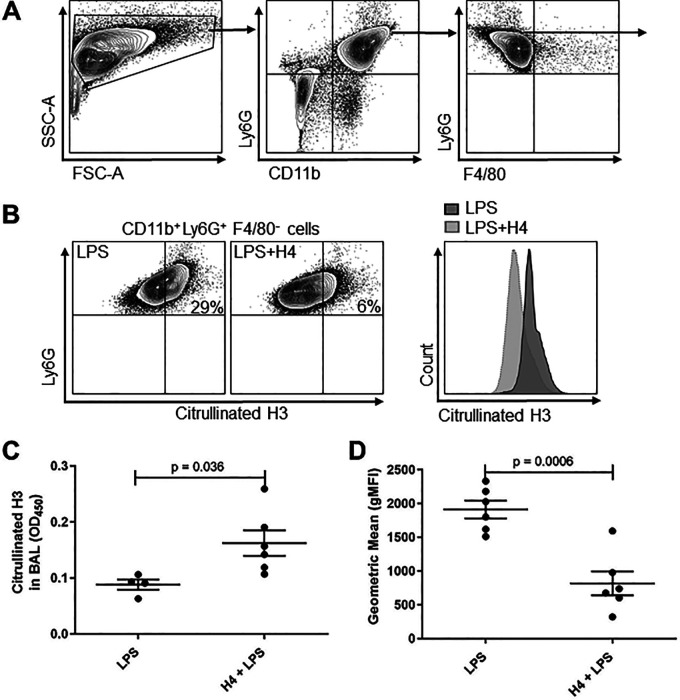
Effects of H4 combined with LPS at 24 h on NETs. (A) BAL cells were stained with surface markers CD11b-PE-Cy7, Ly6G-APC, F4/80-PE, and citrullinated H3-AF488, and gating strategy for selecting CD11b+ Ly6G+ F4/80− neutrophils is shown. (B) Representative flow cytometry analysis and overlay histograms for citrullinated H3 on neutrophils from LPS or LPS with H4 groups. (C) BAL from the mice in Fig. 4 were analyzed by ELISA for citrullinated H3 as a marker of NETs. (D) The experiment was repeated with LPS or H4 and LPS, and mice were sacrificed at 24 h, BAL collected and immediately fixed, and then analyzed by flow cytometry to report the mean fluorescence signal for citrullinated H3 on PMNs using the gating strategy shown in panels A and B. Data shown as individual data points with the mean and standard error represented by solid lines. Data were from two independent experiments that totaled n = 4 to 6 mice per group. FSC, forward scatter; SSC, side scatter.

