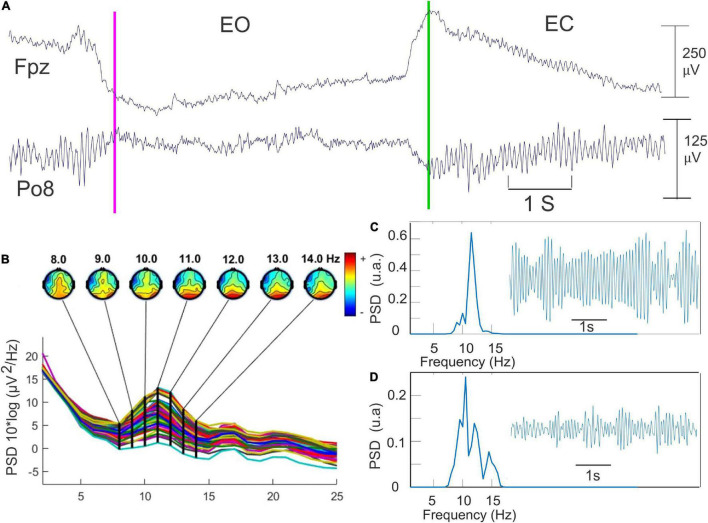
FIGURE 2.
The methodology used for the quantification of the alpha oscillation. (A) Detection of opening (pink line) and closing of the eyes (green line) in Fpz recording. The topographical map provided by the EEGLab toolbox for detecting the scalp electrode presenting the higher alpha power. (B) An example of 6 s of the filtered EEG data (8–14 Hz) recorded during the eye-closed (EC) state. (C) Fast Fourier transform of this data set corresponding of the EC state. (D) the same procedure as in C but during the EO state.

