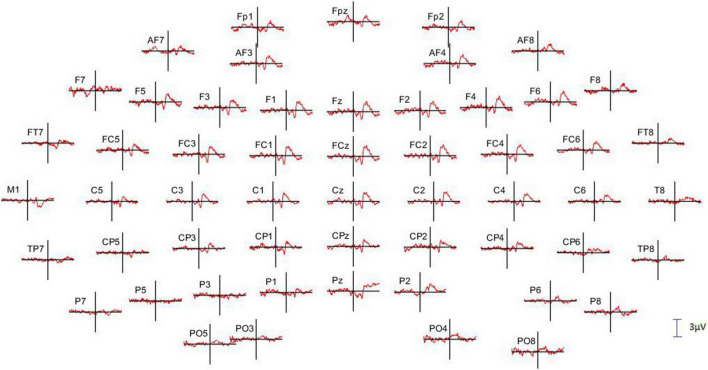
FIGURE 3.
Full scalp array of grand average event-related potential (ERP; n = 6 subjects) showing the fronto-central distribution of the N331-P476 components triggered by the onset of the PWL. The vertical lines indicate the onset of the PWL. Only 55 of the 64 electrodes are illustrated, and the missing ones present too many artifacts. The calibration bar corresponds to 3 μV, positivity up.

