FIGURE 4.

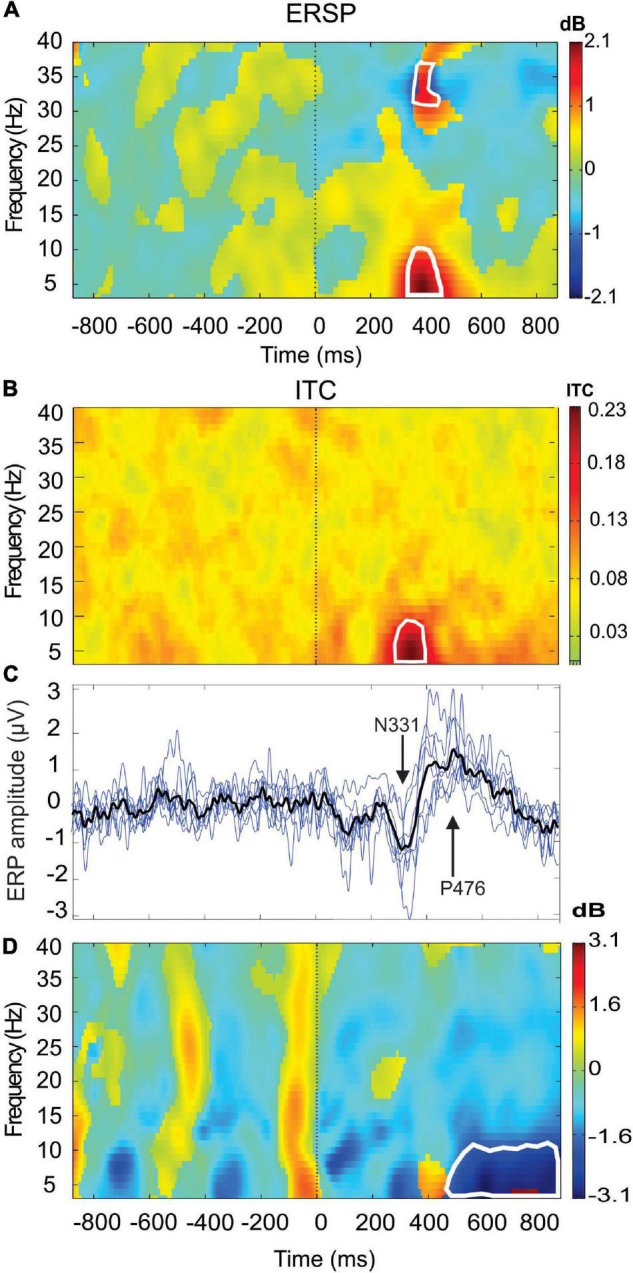
Event-related spectral perturbation (ERSP) (A) and intertrial coherency (ITC) (B) (grand average n = 6 subjects) are recorded at the Fz electrode showing the event-related synchronization (ERS) in the delta-theta–alpha frequency bands concomitant of a theta phase-locking (red area). Also note the presence of beta-gamma ERS. In (C), superimposition of the ERPs of the six single subjects (blue lines) (n = 214 PWL stimulation) and the grand average ERP (black line, n = 1,284). In (D), ERSP is recorded in PO8 electrodes showing a theta–alpha event-related desynchronization (ERD) (blue area). The areas of statistical significance at p < 0.01 are marked by white squares.
