FIGURE 6.

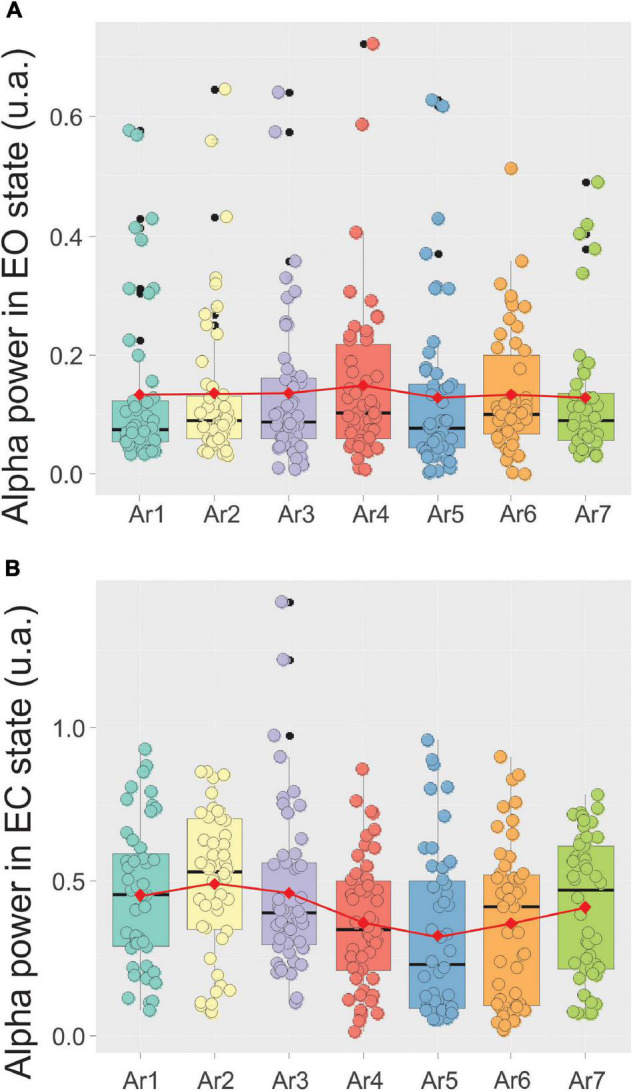
Evolution of the mean ± SD of the alpha power in a box plot configuration in the EC state (A) and the eye opened (EO) state (B) from AR1 (control before the RB session) to AR7, in the 10 subjects of the first control group.

Evolution of the mean ± SD of the alpha power in a box plot configuration in the EC state (A) and the eye opened (EO) state (B) from AR1 (control before the RB session) to AR7, in the 10 subjects of the first control group.