FIGURE 8.

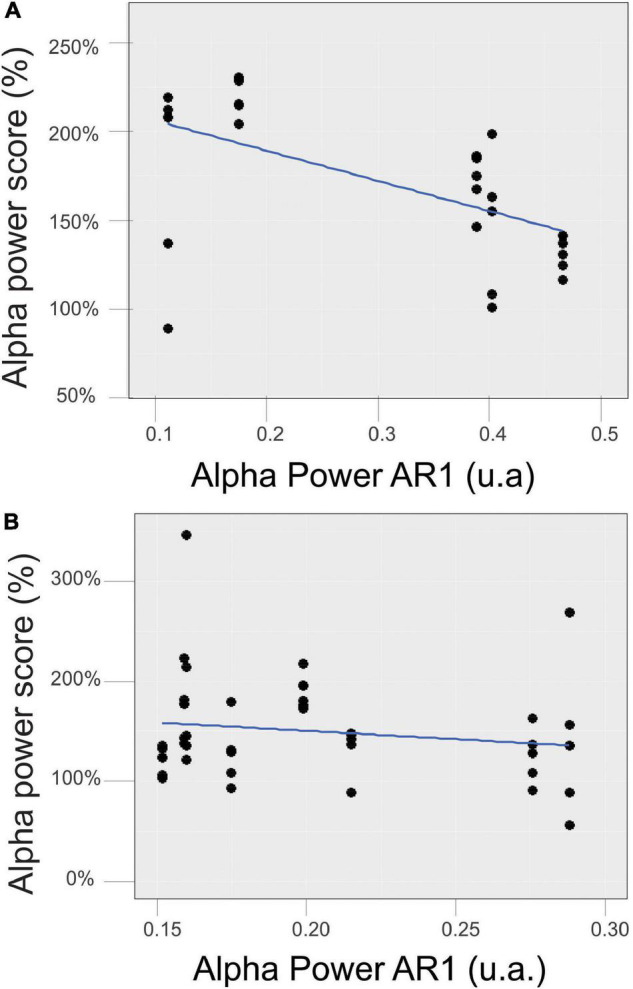
Relationship between the mean initial control value of the alpha power in the EC (A) and EO (B) states measured during AR1 and the mean score reached during the RB session (AR2–AR7).

Relationship between the mean initial control value of the alpha power in the EC (A) and EO (B) states measured during AR1 and the mean score reached during the RB session (AR2–AR7).