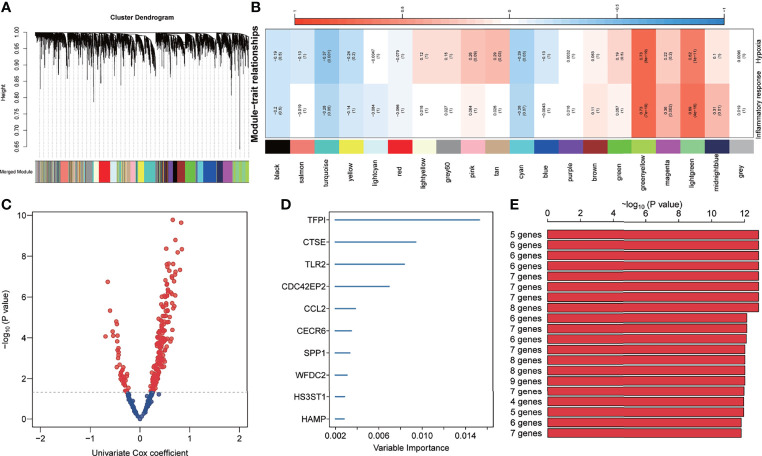
Figure 2.
Development of inflammation response and hypoxia-related gene signature. (A) Cluster dendrogram and co-expression modules were identified using Weighted Gene Co-expression Network Analysis. Each colour represents one module. (B) Correlation analysis between the gene module and inflammatory response and hypoxia-related gene signature. (C) The prognosis-related genes in the green-yellow and light-green modules were screened using univariate Cox regression. (D) The top 10 genes were identified using random survival forest algorithms. (E) The top 20 gene signatures were ranked by -log10 p-value on a Kaplan–Meier plotter.

