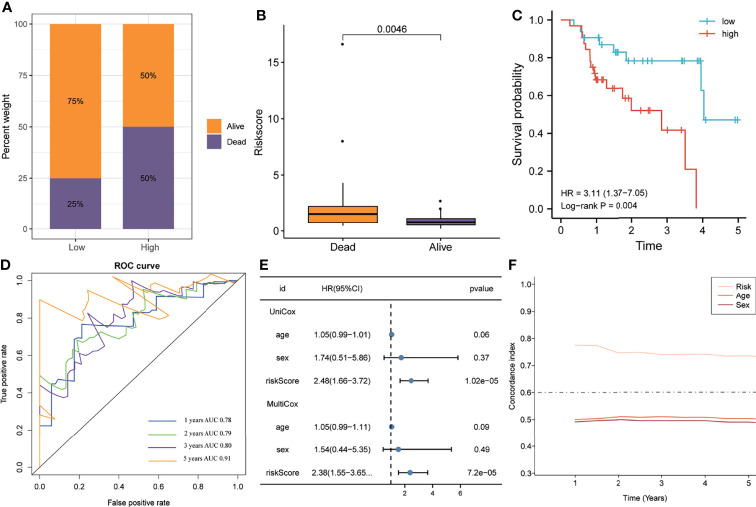
Figure 4.
The predictive ability of the gene signature in the validation cohort. (A) The distribution of survival status in the high- and low-risk groups. (B) The distribution of the gene signature risk scores between patients who have died and patients who are alive. (C) Survival curves were plotted using the Kaplan–Meier method and compared using the log-rank test. (D) The area under the receiver operating characteristic curve value of the risk model for 1-, 2-, 3- and 5-years is 0.78, 0.79, 0.80 and 0.91 respectively. (E) Univariate and multivariate Cox regression analyses of the risk model. (F) Time-dependent concordance index exhibits the excellent predictive ability of the risk model.

