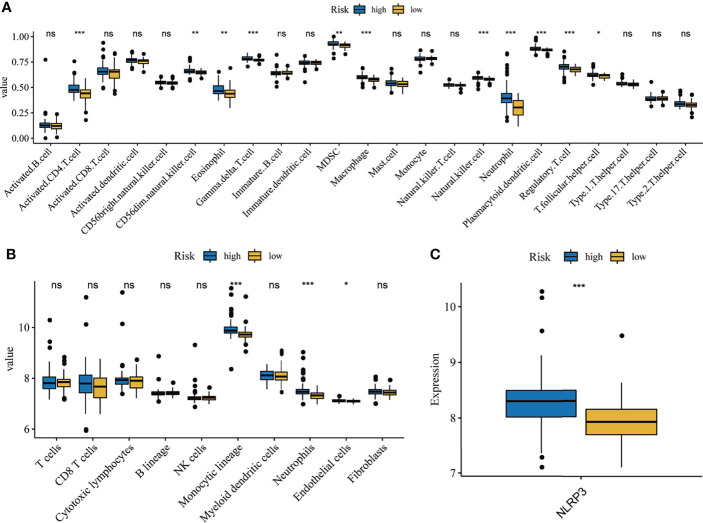
Figure 8.
Correlation analysis of immune and inflammation. Differentially composition of infiltrated immune cells between high- and low-risk group via ssGSEA (A) and MCP counter (B)analysis. (C) The expression levels of NLRP3 between high-and low-risk groups. *p < 0.05, **p < 0.01, ***p < 0.001, ns, no significance.

