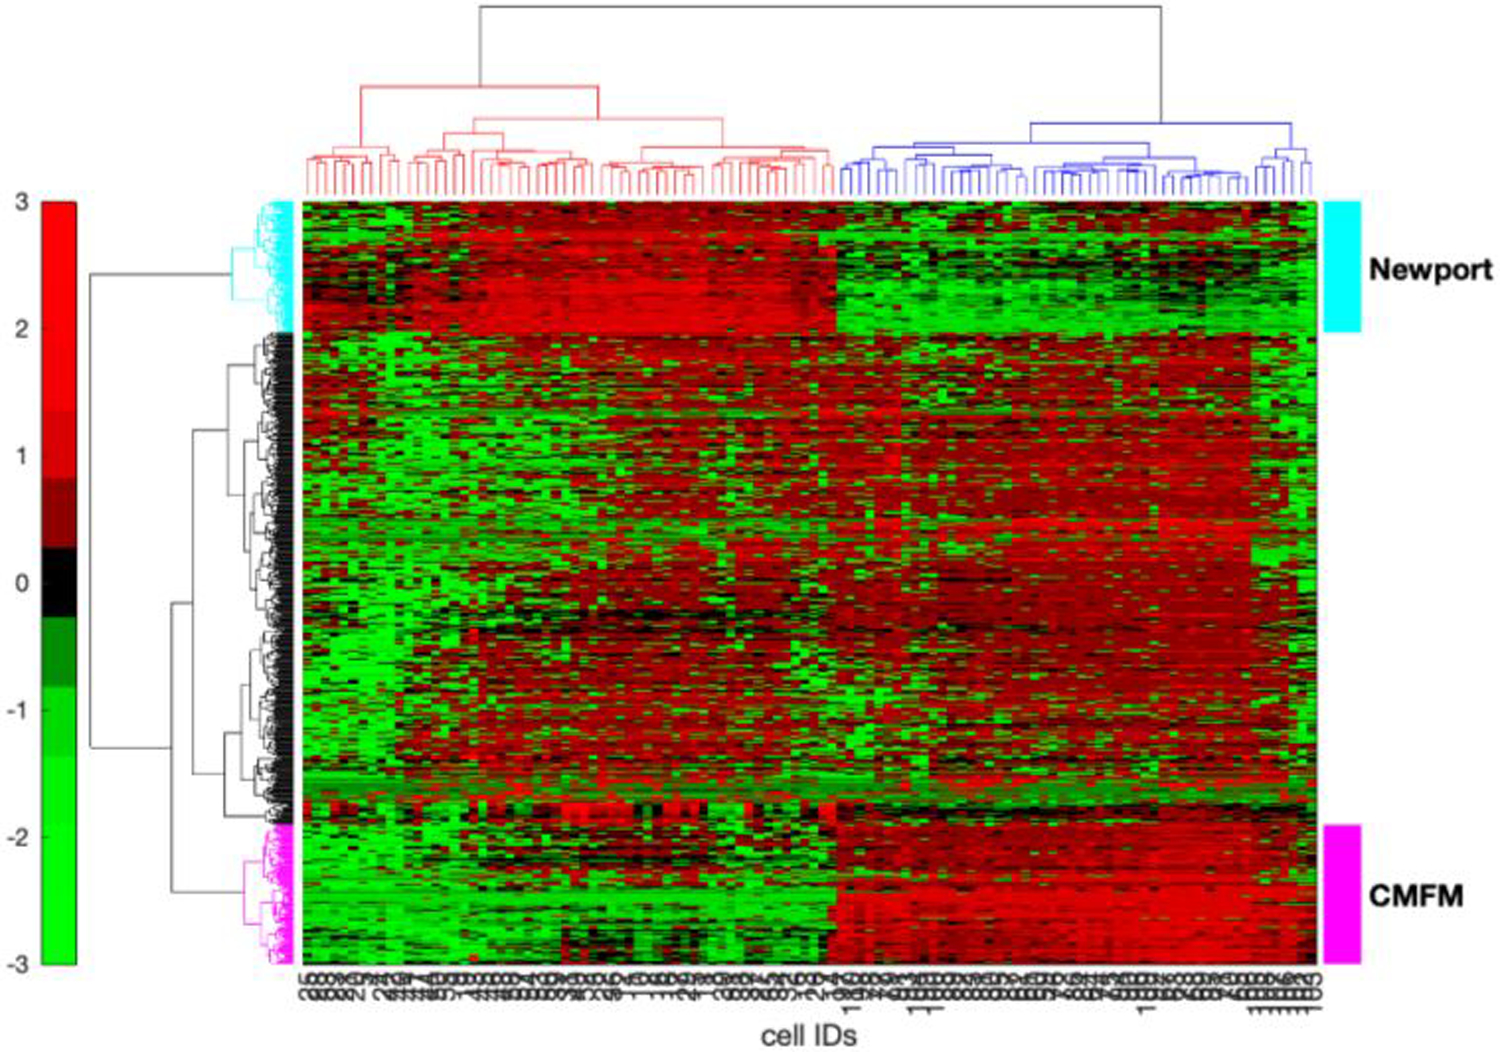
Figure 4.

Clustergram of proteins with the highest 25% variance after normalization. Data are organized with proteins as rows and cells as columns. The algorithm clearly resolved those cells which were extracted using the Newport buffer (red column dendrogram, cells 1–58) and the CMFM buffer (blue column dendrogram, cells 59–110). One set of proteins that showed higher expression in the Newport buffer is annotated as Newport (cyan row dendrogram, 110 proteins) whereas the other set of proteins that showed higher expression in the CMFM buffer (magenta row dendrogram, 116 proteins).
