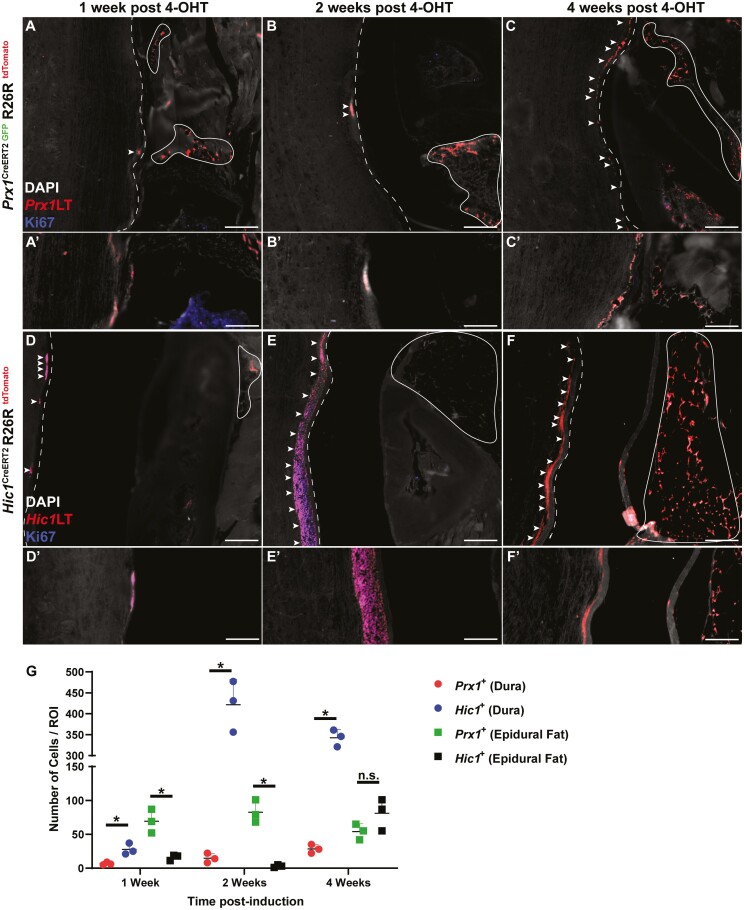
Figure 2.
Prx1 + (A-C) and Hic1+ (D-F) MPC lineage tracing 1-, 2-, and 4-week post-tamoxifen induction. Sections were also stained with Ki67 to identify proliferative cells (A-F). The dura mater is highlighted by the dashed line while the epidural fat is encircled by the solid line. Arrows indicate examples of Prx1+ and Hic1+ cells within the dura mater. Quantification of Prx1+ and Hic1+ MPCs within the dura mater and epidural fat (G). An n = 3 mice were used per group per time point. ∗P < .05. Scale bars = 100 µm. Abbreviations: Hic1, hypermethylated in cancer 1; MPCs, mesenchymal progenitor cells; Prx1, paired related homeobox-1.

