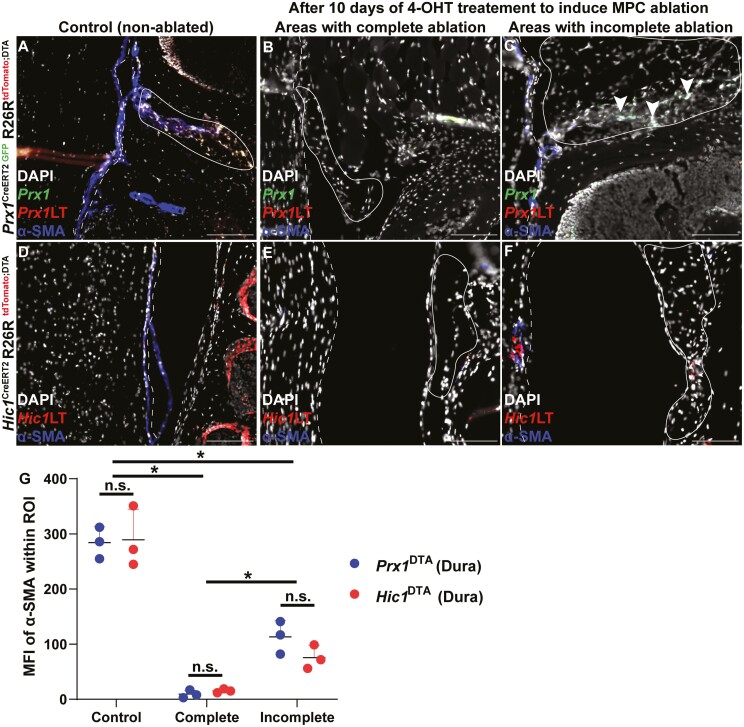
Figure 5.
α-SMA expression in the dura mater of wild-type controls (A, D) and after Prx1 (B, C) or Hic1 (E, F) MPCs are ablated following 10 days of tamoxifen induction. The dura mater is outlined by the dashed line while the epidural fat is encircled by the solid line. Arrows indicate examples of Prx1+ and Hic1+ MPCs in the epidural fat. Quantification of mean fluorescent intensity (MFI) of α-SMA expression in Prx1+ and Hic1+ mice within the dura mater (G). An n = 3 mice were used per group per time point. ∗P < .05. Scale bars = 100 µm. Abbreviations: Hic1, hypermethylated in cancer 1; MPCs, mesenchymal progenitor cells; Prx1, paired related homeobox-1; α-SMA, alpha-smooth muscle actin.

