Figure 4.
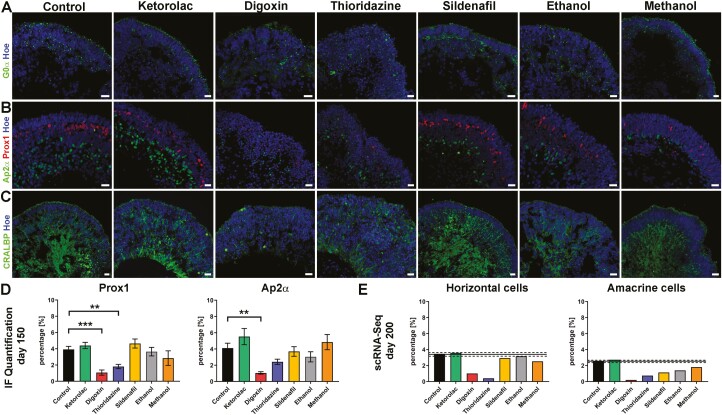
Drug effects on bipolar, horizontal, amacrine, and Müller cells of WT3-derived retinal organoids. (A-C): Expression of bipolar cells (G0α; green), horizonal cells (Prox1; red), amacrine cells (Ap2α; green) at day 150 of differentiation. Expression of bipolar marker G0α was found in all retinal organoids, even after drug treatment (A). Prox1-positive horizontal cells were located closer to the photoreceptor layer than amacrine cells, which were more distal in the organoids (B). Prox1-positive cells were disorganized after thioridazine and digoxin exposure; the same was observed for Ap2α-positive cells only after digoxin incubation (B). Müller glia cells stretched through the whole neuroepithelium of organoids (C). Their organization was affected in digoxin and thioridazine-treated organoids, showing a total disruption of Müller glia cells after digoxin exposure. Nuclei were counterstained with Hoechst (blue). Scale bars, 20 μm (D): Immunofluorescence quantification of Prox1 and Ap2α for all conditions, revealed a decline in Prox1 and Ap2α percentage after digoxin exposure, while thioridazine treatment resulted in a reduction of Prox1-positive cells only. Data shown as mean ± SEM, N = 2 (independent experiments), and 5-12 images from different organoids were quantified per condition. Differences were considered statistically significant at ∗∗P <.01 and ∗∗∗P <.001. (E): Single-cell RNA-Seq data for horizontal and amacrine at day 200 of differentiation, indicated a downregulation in the percentage of horizontal and amacrine cells (horizontal cell cluster. 13; amacrine cell 18). Data are shown as an individual percentage for each cell type and condition. The mean (black line) ± SEM (dashed line) of control and Ketorolac conditions are shown. Hoe, Hoechst.

