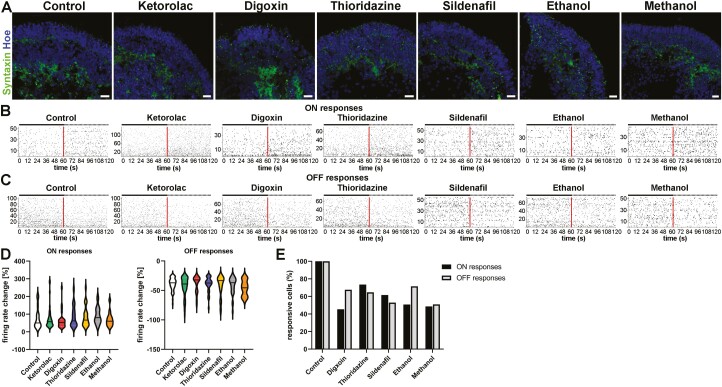
Figure 6.
Drug effects on the physiological function of retinal organoids derived from WT3 iPSCs. (A): Syntaxin expression (green) was observed in retinal organoids putative OPL and IPL, showing less organized layer-like expression after ethanol exposure. Nuclei were counterstained with Hoechst (blue). Scale bars, 20 μm. (B, C): Spike raster plots from putative ON-center retinal ganglion cells (RGCs; B) and Off-center RGCs (C) of WT3-derived retinal indicated an increase in spiking activity for ON-center like RGCS and a decline in their spiking activity for Off-center like RGCs after white light pulses (WLP). Each row represents a different RGC, and each vertical bar represents a spike from the corresponding RGC. The red line illustrates the stimulus onset whereas the left half before indicates the spontaneous (baseline) activity before WLP exposure and the right half when exposed to WLP. (D): Violin plots show the percentage (%) firing rate change of putative ON-RGCs and OFF-RGCs after WPL, revealing no significant differences (Mann-Whitney test). Data are represented by the median and interquartile ranges with Tukey whiskers. (E): Number of active RGCs (in %) for all drug conditions in relation to control groups (control and ketorolac) indicated less spiking RGCs for ON-center- and Off-center-like responses after WPL in all drug-treated retinal organoids.

