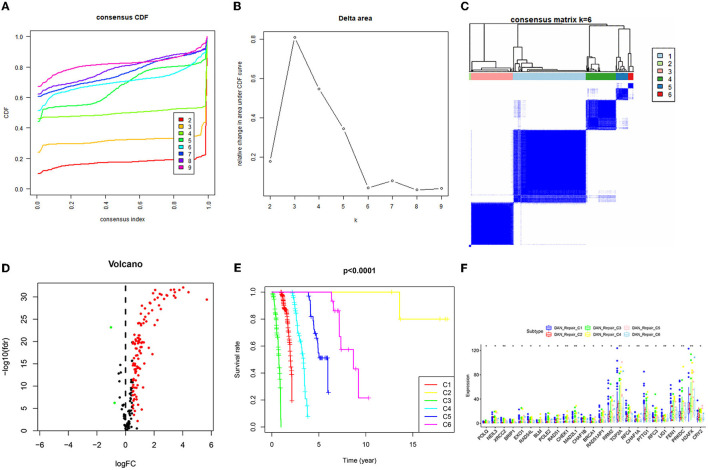
Figure 2.
Consistent clustering results of DNA repair related genes and screening of differential genes. (A) Consistent Cumulative Distribution Function (CDF) diagram: this diagram shows the cumulative distribution function when k takes different values, which is used to determine when k takes the value, CDF reaches an approximate maximum value, and the cluster analysis result is the most reliable at this time. (B) Delta Area Plot: this graph shows the relative change of the area under the CDF curve between k and k-1. When k = 7, the area under the curve only increases slightly, so 6 is the appropriate value of k. (C) Matrix heat map when k = 6: the rows and columns of the matrix are all samples, and the values of the consistency matrix range from 0 (it is impossible to cluster together) to 1 (always cluster together) from white to dark blue Color indicates that the consistency matrix is arranged according to the consistency classification (the tree diagram above the heat map). The bar between the dendrogram and the heat map is the category. (D) The differential gene volcano map describes the situation of the differential gene. The y-axis of the volcano graph is –log10 (Qvalue), that is, qvalue (value after pvalue correction) is –log10, so the higher the value, the smaller the qvalue is, the more significant it is. The abscissa is Log2 fold change, that is, log2 is taken for fold change, so the closer the points on both sides (each point represents a gene), the greater the increase or decrease in gene expression. (E) Survival prognosis curves of different categories. (F) Genes with significant differences in the C1–C6 categories.

