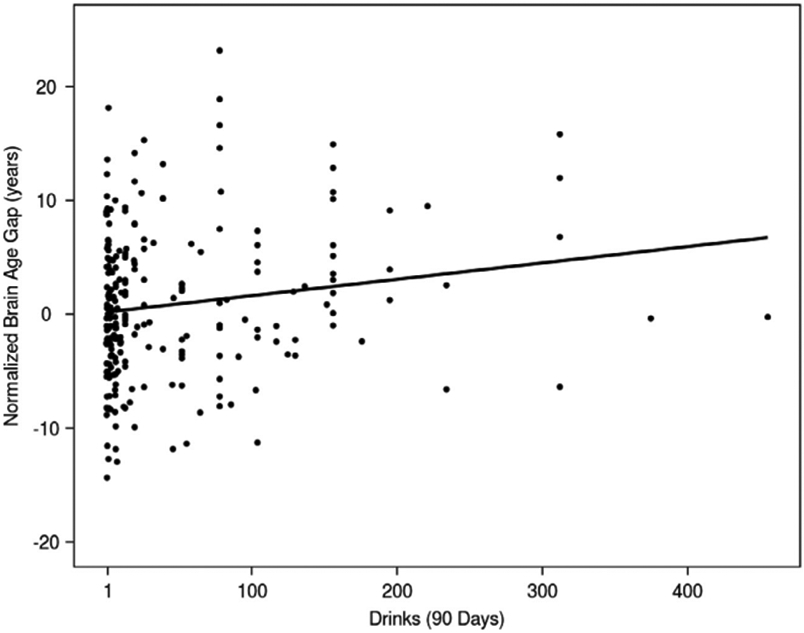
Fig. 2. Association between total number of drinks consumed over 90 days and the brain age gap in the discovery sample.

Fig. 2. Normalized brain age gap and its association with the number of drinks consumed in the previous 90-day assessment period in the discovery sample (n = 240). The normalized brain age gap was calculated by subtracting the mean brain age gap from each individual brain age gap. Therefore, a normalized brain age gap equal to zero indicates no difference from the mean brain age gap. The linear regression model predicting brain age gap showed a significant, positive association between the total number of drinks consumed in the 90-day period and the brain age gap (β = 0.014, p = 0.023, partial R2 = 0.015). The variability in the brain age gap indicates that alcohol consumption plays a small, but significant, role in accelerated brain age predictions.
