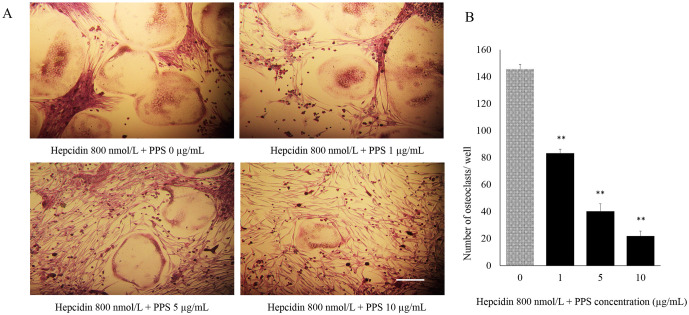
Fig 3. Inhibitory effect of PPS on OC treated with hepcidin 1.
The cells were treated with various concentrations of PPS followed by 800 nmol/L hepcidin 1, M-CSF (20 ng/mL) and RANKL (50 ng/mL) for 7 days. (A) The cells were stained for TRAP stain and TRAP-positive cells (≥3 nuclei) were counted. Scale bar- 200 μm. (B) Bar graphs show the number of OC cells/well. Data are representative of three independent experiments and expressed as means ± SE. Means with *are significantly different from 0 μg/mL of PPS (*p < 0.05, **p < 0.01).

