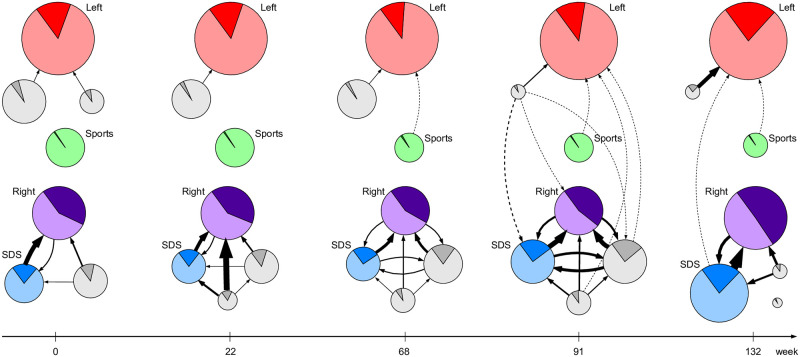
Fig 2. Fractions of unacceptable tweets posted by different communities.
Nodes are the largest detected communities at timepoints t = 0, 22, …, 132. The node size indicates the community size, darker areas correspond to unacceptable tweets, and lighter areas to acceptable tweets. An edge denotes the external influence of community Ci to Cj. Linked communities form super-communities: left-leaning (Left, top), Sports (middle), and right-leaning (Right and SDS, bottom).

