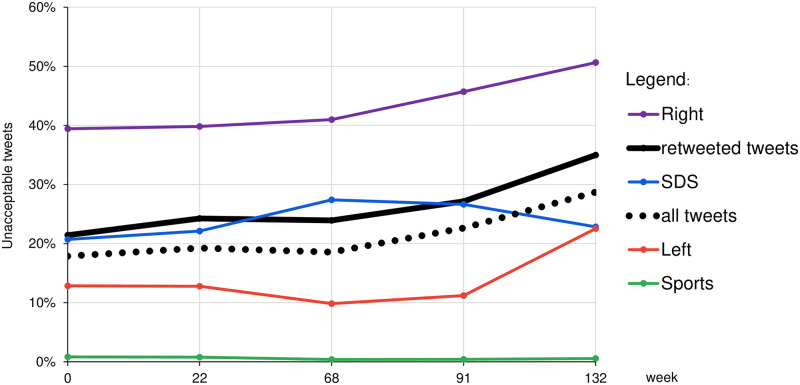
Fig 3. Fractions of unacceptable tweets posted by the major communities and overall, at weekly timepoints t = 0, 22, …, 132.
The solid black line represents all the tweets that were retweeted and are used to form retweet networks and communities. The dotted black line represents all the tweets posted. The largest communities are Left, Right, and SDS. For a comparison, we also show Sports, a small community with almost no unacceptable tweets.

