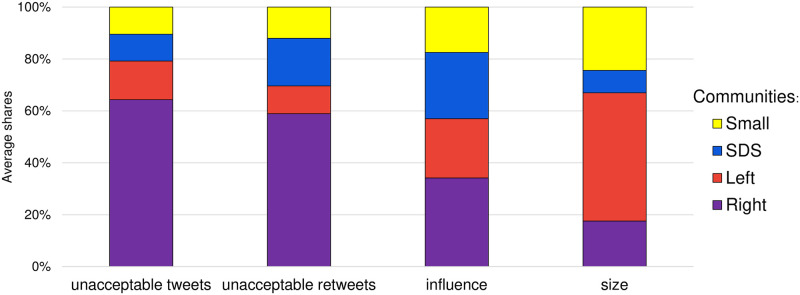
Fig 5. Comparison of the three major communities in terms of four different properties.
Each bar is composed of the Right, Left, SDS, and the remaining Small communities, from bottom to top. Bars correspond to the average shares (over the five weekly timepoints) of posted unacceptable tweets, retweeted unacceptable tweets, community influence (weighted out-degree), and size of the community, from left-to-right, respectively.

