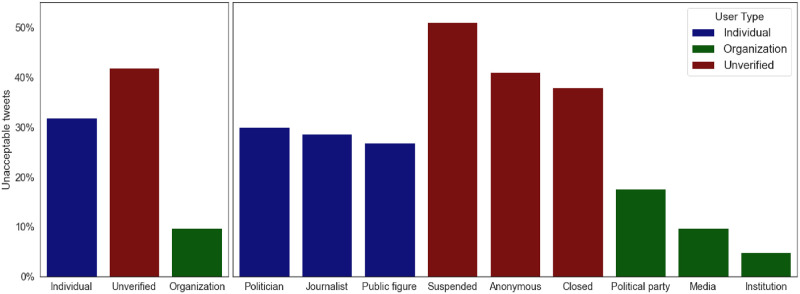
Fig 7. Fractions of unacceptable tweets posted by different types of users.
The left bar chart shows major user types. Each major user type consists of three subtypes, shown at the right bar chart with the same color. Individual bars indicate the fraction of all tweets posted by the user (sub)type that are unacceptable.

