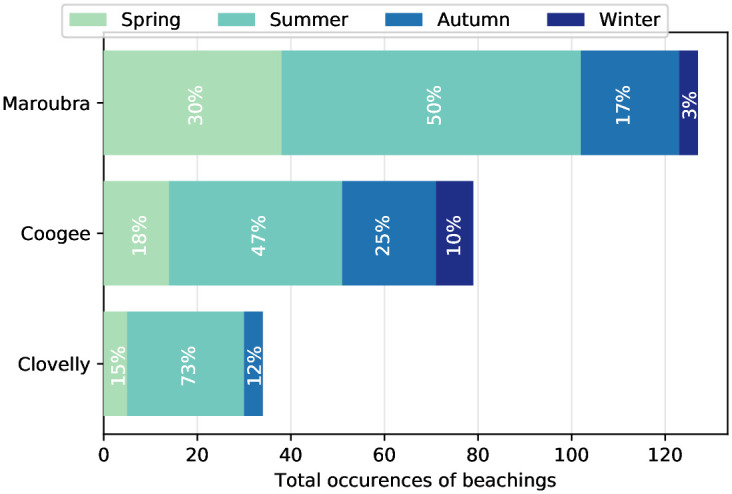
Fig 4. Bar plot for each beach, showing the occurrence of observed beaching events for each season (see legend) from the 2016–2020 daily lifeguard data.

The total occurrences indicate the number of days over the four years and the percentages for each season are relative to the total numbers of occurrences per beach (e.g. in Maroubra 50% of the beachings occurred in summer). Winter months are not seen for Clovelly as there is no data.
