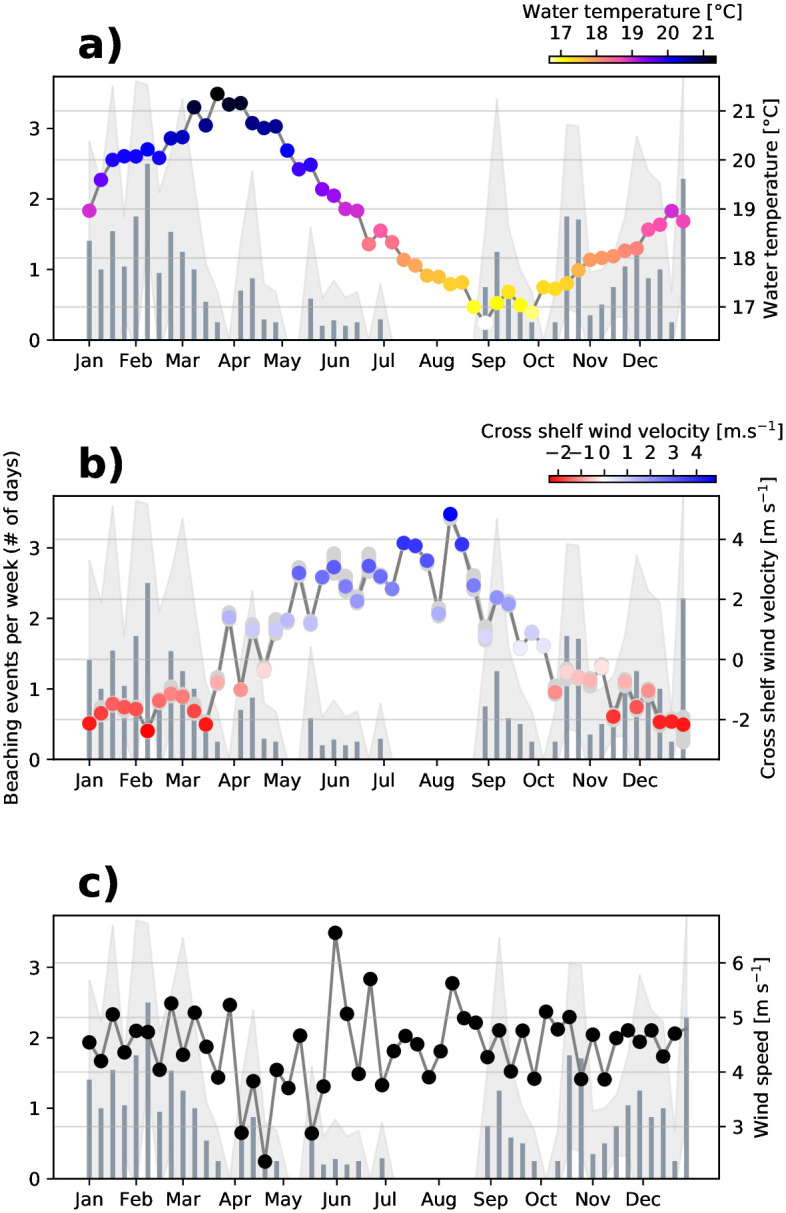
Fig 5. Weekly climatology of beaching events and environmental variables at Maroubra.

Grey bars on all panels show the number of beaching events per week over 2016–2020 and the standard deviation is shown in light grey shading. In panel a, the weekly mean water temperature is overlaid (right axis and colours). In panel b, the weekly mean cross-shore wind velocity component is overlaid (right axis and colours) with positive (negative) values showing wind from (towards) the coast. In panel c, the mean weekly wind speed is overlaid (right axis).
