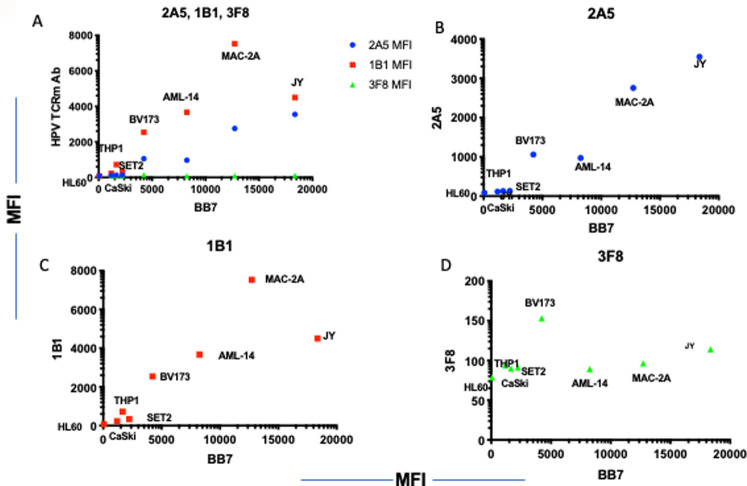
Fig 3. Correlation of HPV mAb binding and HLA-A2 expression.
A panel of cell lines with variable amounts of HLA-A2 on the cell surface were stained with mAbs 1B1, 2A5 and 3F8 at 3ug/ml and BB7.2 to HLA-A2. HPV mAb binding is shown in Y-axis and HLA-A2 expression in X-Axis. [A] A comparison of all 3 mAb on the same plot. Each mAb alone is plotted: 2A5 [B], 1B1 [C], 3F8 [D]. The data is one representative from five independent experiments.

