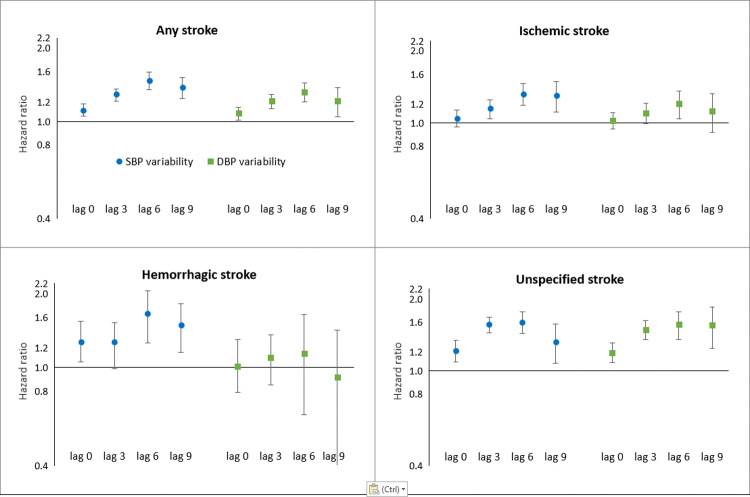
Fig 2. The association between blood pressure variability and incident stroke using different lag periods.
The blue dots and green squares represent the hazard ratio of incident stroke per SD increase in systolic blood pressure (SBP) variability and diastolic blood pressure (DBP) variability, respectively. The error bars show the 95% confidence intervals around the estimates. The lag 0 models were adjusted for age, sex, mean SBP or DBP, education, BMI, smoking, alcohol consumption, cholesterol, high-density lipoprotein cholesterol, lipid-lowering medication use, blood-pressure-lowering medication use, anti-thrombotic medication use, type 2 diabetes mellitus, atrial fibrillation, prior coronary heart disease, and type of blood pressure measuring device. Lag 3, lag 6, and lag 9 analyses were adjusted for age, sex, mean SBP or DBP, and propensity score based on all other covariates. Lag 0 represents no time interval between blood pressure variability measurement and follow-up for incident stroke, lag 3 represents a time interval of 3 years between blood pressure variability measurement and follow-up for incident stroke, and so on.

