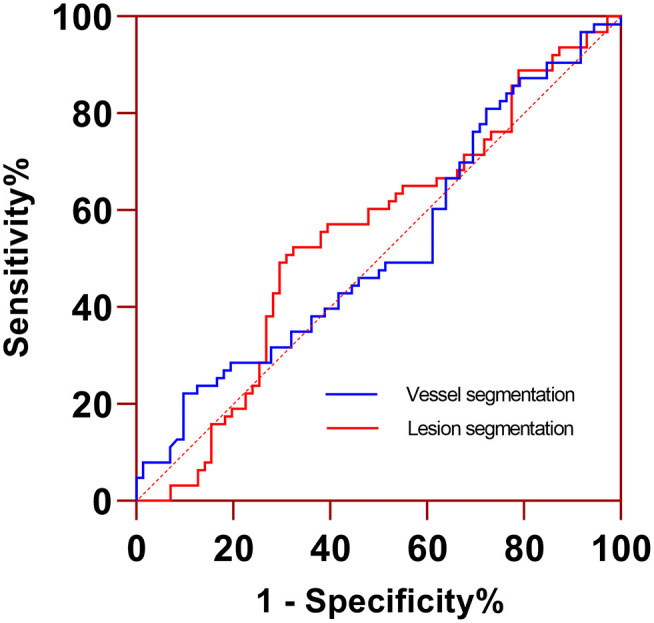
Figure 4.

ROC curve analysis of PCAT CT attenuation measured from lesion- and vessel-based segmentations for identifying functionally significant coronary stenosis. Two segmentations had similar AUC (0.547 vs. 0.524, p = 0.814). AUC, area under the curve; ROC, receiver operating characteristic curve.
