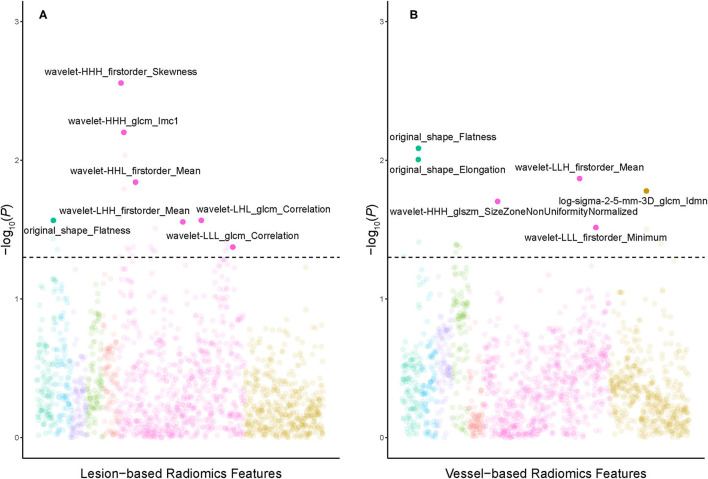
Figure 5.
Manhattan plots demonstrated the strength of association [–log10 (P-value)] of univariate logistic regression] comparing PCAT radiomics features derived from lesion-based (A) and vessel-based (B) PCAT segmentation against the hemodynamic significance of coronary stenosis. Solid points above the horizontal cutoff line denote features qualified for univariate logistic regression and LASSO-logistic regression, and their corresponding feature names are displayed. LASSO, least absolute shrinkage and selection operator; PCAT, pericoronary adipose tissue.

