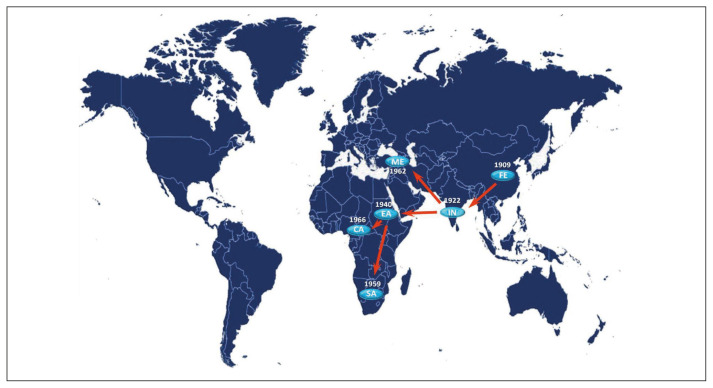
Figure 5.
Significant non-zero migration rates of VARV P1 worldwide supported by a Bayes Factor >4. The migrations were calculated using SPREAD program. The dates in which the virus entered the area and the direction of fluxes are shown (CA = central Africa; EA = eastern Africa; FE = Far East; IN = India; ME = Middle East; SA = southern Africa).

