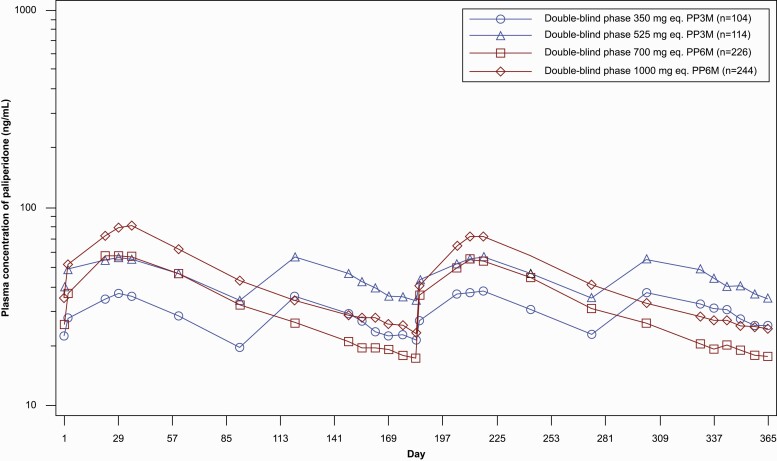
Figure 2.
Semi-logarithmic mean (SD) plasma concentration time profiles of paliperidone after administration of PP3M at 350 or 525 mg eq. and PP6M at 700 or 1000 mg eq. (PK data analysis set) in the DB phase. The x-axis displays the day relative to the day of dosing (day 1) in the DB phase. Abbreviations: DB, double-blind; PK, pharmacokinetics; PP3M, paliperidone palmitate 3-month formulation; PP6M, paliperidone palmitate 6-month formulation.

