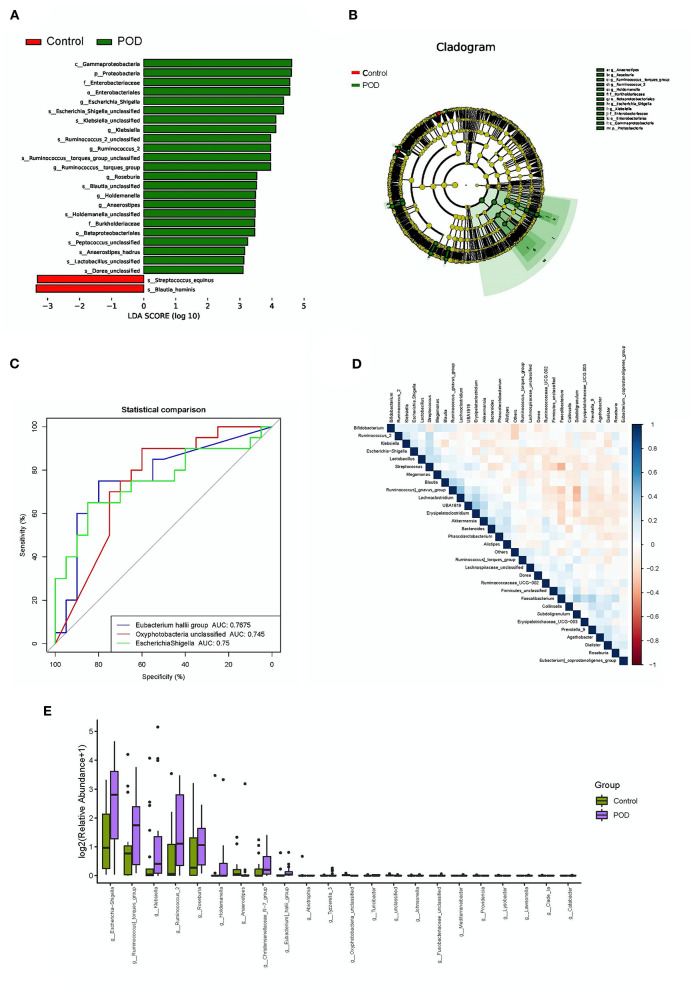
Figure 3.
Differential abundance and diagnostic efficacy of gut bacterial between POD and control cohorts. (A) Linear discriminant analysis effect size (LEfSe) of differentially abundant bacteria; (B) Cladogram of differentially abundant bacteria; (C) Receiver operating characteristic curve analysis of the diagnostic efficacies of bacteria (AUC > 0.7); (D) Correlation analysis among bacteria; (E) Differentially abundant bacteria in Genus level.

