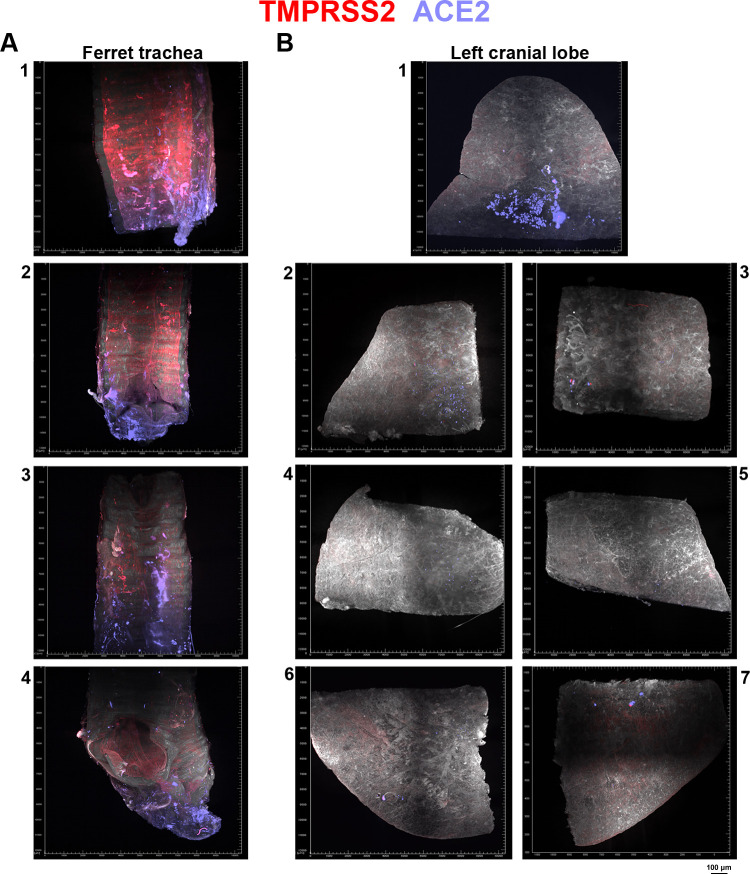
Fig 7. ACE2 and TMPRSS2 expression in the ferret animal model.
TMPRSS2 fluorescence signal in red and ACE2 signal in purple. (A) In the ferret trachea, TMPRSS2 expression is observed with occasional ACE2 signal. Ferret trachea was cut into multiple pieces due to dimensional limitations of the microscope and after imaging and analysis the ferret trachea imaging data was placed in the order the ferret trachea was cut in, with panels 1–4 comprosing these cut trachea parts. Panel 1, part of the trachea that attaches to the ferret head with panel 4 being the part that is attached to the left cranial lobe. Panel 2 and 3 are parts of the trachea that are attached to the parts in panel 1 and 4. (B) In the left cranial lobe, minimal ACE2 expression is observed with no apparent TMPRSS2 signal. The left cranial lobe was cut into seven pieces, shown in panel 1–7. With panel 1 being the upper portion and panel 6/7 being the lower portion of the lobe, panel 2–5 are the pieces that connect panel 1 and 6/7 to form the entire cranial lung lobe.

