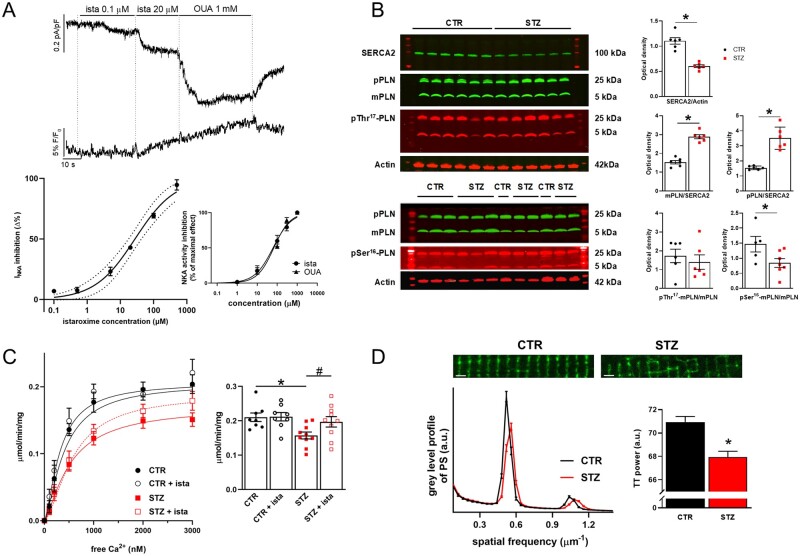
Figure 1.
Istaroxime affinity for rat NKA. Changes in SERCA2, PLN levels, and TT expression in STZ vs. CTR rats. (A) Top: recordings of NKA current (INKA) and Ion NaTRIUM Green-2 fluorescence (Hp −40 mV) during exposure to increasing concentrations of istaroxime and, finally, to 1 mmol/L ouabain (OUA). Bottom: concentration-dependent INKA inhibition by istaroxime in isolated CTR LV myocytes (the best logistic fit and confidence intervals are shown, N = 5, n = 6–27). Concentration-dependent NKA activity inhibition by istaroxime and OUA in cardiac preparations is shown in the inset (N = 5). (B) Left: western blot for SERCA2, monomeric (m) and pentameric (p) PLN, pSer16-PLN and pThr17-PLN in STZ (N = 6,7) and CTR (N = 5,6) cardiac homogenates. Right: densitometric analysis; values are expressed as optical density in arbitrary units. *P<0.05 vs. CTR (unpaired t-test). (C) Left: Ca2+ activation curves of SERCA2a activity measured as cyclopiazonic acid sensitive component in cardiac SR homogenates from CTR (N = 8) and STZ (N = 10) rats with or w/o 500 nmol/L istaroxime. Right: statistics of the maximum velocity (Vmax) of the Ca2+ activation curves estimated by sigmoidal fitting. *P<0.05 vs. CTR (unpaired t-test), #P<0.05 vs. STZ (paired t-test). (D) Top: confocal images of di-3-ANEPPDHQ (20 µmol/L) loaded CTR and STZ myocytes (horizontal bars 2 µm). Bottom: mean power spectrum profile of TT in CTR (N = 5, n = 114) and STZ (N = 9, n = 181) group; average results of the power of the periodic component on the right. *P<0.05 vs. CTR (unpaired t-test).

