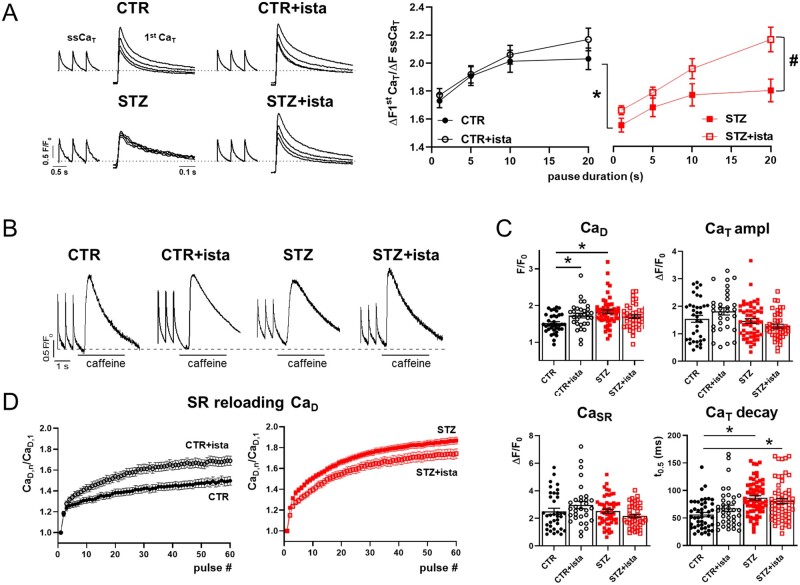
Figure 2.
STZ-induced changes in dynamics in field stimulated myocytes. Analysis of istaroxime effects. (A) Left: post-rest potentiation protocol in Fluo4 field stimulated (2 Hz) myocytes; steady state Ca2+ transients (ssCaT) and superimposed first Ca2+ transients (1st CaT) following increasing resting pauses (1–5–10–20 s) are reported in CTR and STZ myocytes, with or w/o 100 nmol/L istaroxime. Traces were normalized to own diastolic Ca2+ (CaD) level (dotted lines). Right: analysis of the 1st CaT amplitude normalized to the amplitude of the pre-pause ssCaT and its pause-dependency. CTR N = 5 (w/o istaroxime n = 44, with istaroxime n = 34), STZ N = 3 (w/o istaroxime n = 35, with istaroxime n = 23). *P<0.05 vs. CTR w/o istaroxime; #P<0.05 vs. STZ w/o istaroxime (two-way ANOVA plus post hoc Sidak’s multiple comparisons). (B) ssCaT and caffeine-induced CaT evocated in field stimulated CTR and STZ myocytes with or w/o 100 nmol/L istaroxime (the dotted line indicates the CaD in CTR w/o istaroxime). (C) Statistics for ssCaD, ssCaT amplitude, caffeine-induced CaT (named CaSR), and ssCaT half decay time (t0.5). CTR N = 5 (n = 36 w/o istaroxime, n = 31 with istaroxime), STZ N = 7 (n = 52 w/o istaroxime, n = 42 with istaroxime). *P<0.05 vs. CTR w/o istaroxime (one-way ANOVA plus post hoc Tukey’s multiple comparisons). (D) Changes in CaD during the reloading process after caffeine-induced SR depletion. CaD values (CaD,n) were normalized to the 1st pulse CaD (CaD,1). CTR N = 5 (n = 36 w/o istaroxime, n = 29 with istaroxime), STZ N = 7 (n = 49 w/o istaroxime, n = 43 with istaroxime).

