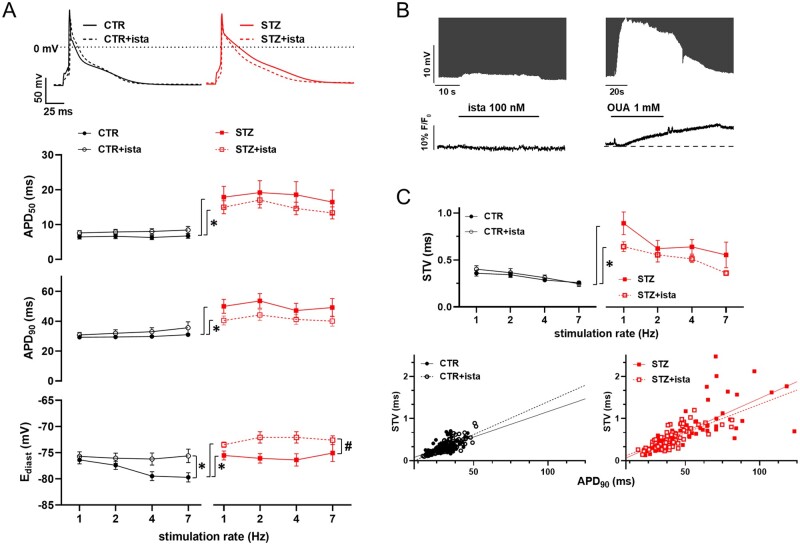
Figure 3.
STZ-induced changes in electrical activity. Analysis of istaroxime effects. (A) Top: representative AP recorded at 1 Hz in CTR and STZ myocytes with or w/o 100 nmol/L istaroxime. Bottom: rate-dependency of AP parameters (APD50, APD90, Ediast) in CTR and STZ myocytes with or w/o 100 nM istaroxime. CTR N = 4 (n = 29 w/o istaroxime, n = 25 with istaroxime), STZ N = 3 (n = 24 w/o istaroxime, n = 19 with istaroxime). *P<0.05 vs. CTR w/o istaroxime, #P<0.05 vs. STZ w/o istaroxime (two-way ANOVA plus post hoc Sidak’s multiple comparisons). (B) Effects of 100 nmol/L istaroxime superfusion on Ediast (top, AP y axis zoomed to highlight changes) and (bottom) in comparison to the effect of 1 mmol/L OUA in CTR myocytes loaded with Ion Natrium Green-2 and stimulated at 7 Hz. (C) Top: rate-dependency of APD90 STV in each experimental group. CTR N = 4 (n = 27 w/o istaroxime, n = 21 with istaroxime), STZ N = 3 (n = 24 w/o istaroxime, n = 20 with istaroxime). *P<0.05 vs. CTR w/o istaroxime (two-way ANOVA plus post hoc Sidak’s multiple comparisons). Bottom: linear correlation between STV of APD90 and APD90 values in CTR and STZ groups; data from all stimulation rates were pooled.

