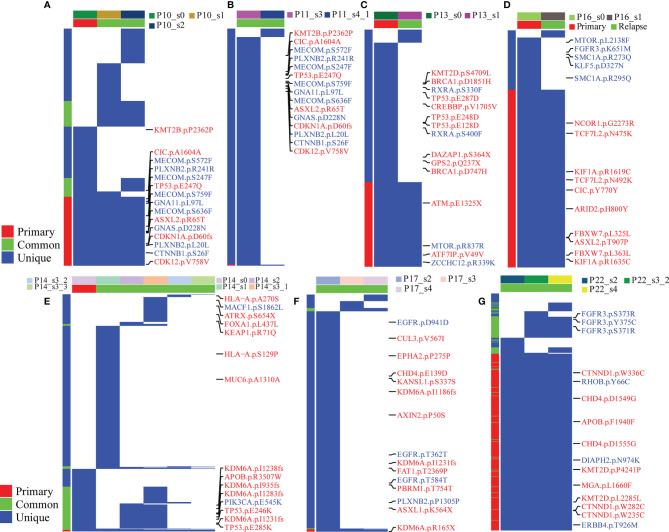
Figure 4.
Branching evolution in BCG-treated tumor samples. The fraction of tumor cells with common, primary, and unique clonally adjusted mutations for each tumor sample is shown for all patients with at least more tumor samples per patient. Blue color stands for mutations in the corresponding genes. In the right panel of each figure, labels with red color stand for tumor suppressor genes and blue for oncogenes. In the left panel, the red color is the mutations detected in all samples, the blue color is the mutations found in more than one sample, and the green color is for the unique mutation in one sample. In the top panel, different colors stand for the group information (primary or relapsed) and samples. (A–G) stand for different patients: (A) for P10, (B) for P11, (C) for P13, (D) for P16, (E) for P14, (F) for P17 and (G) for P22.

