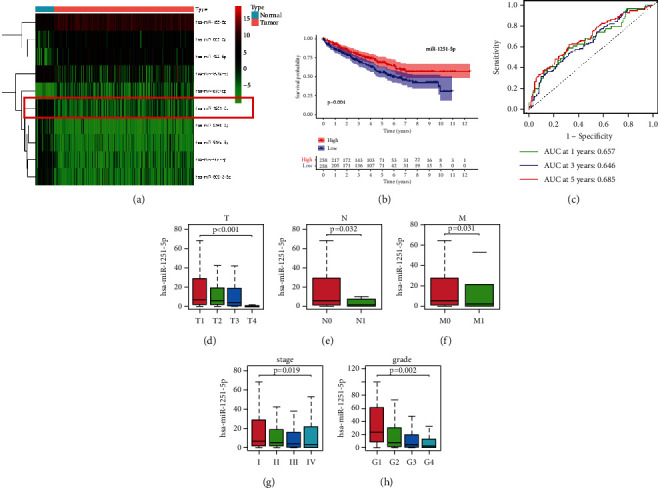
Figure 1.

Expression, survival prediction, and correlation of clinical parameters of miR-1251-5p in ccRCC patients. (a) Heatmap for miRNAs shows the darker the color, the greater the level of expression. (b) High-expression groups have higher life durations over low-expression groups, corresponding to a Kaplan–Meier survival study. The high-expression group is depicted by the red line, while the low-expression group is depicted by the blue line. (c) Risk signature-based time-dependent ROC lines indicate one-year, three-year, and five-year survival. (d) Interaction of the miR-1251-5p using T staging. (e) Interaction of the miR-1251-5p using N staging. (f) Interaction of the miR-1251-5p using M staging. (g) Interaction of the miR-1251-5p using clinical stage. (h) Interaction of the miR-1251-5p using grade. ∗p < 0.05 and ∗∗p < 0.01.
