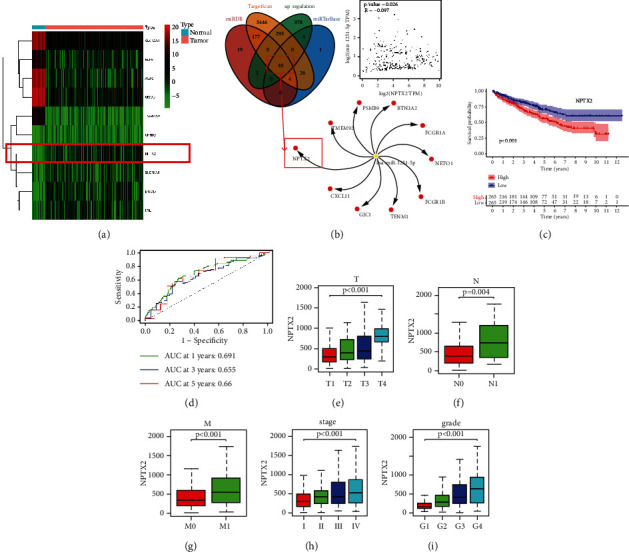
Figure 2.

Expression, survival prediction, and correlation of clinical parameters of NPTX2 in ccRCC patients. (a) Heatmap for mRNAs shows that the darker the color, the greater the level of expression. (b) The intersection of miRDB database, StarBase database, TargetScan database, and upregulation of mRNAs for potential regulatory factors. (c) High-expression groups have higher survival time than low-expression groups, corresponding to a Kaplan–Meier survival study. The high-expression group is expressed by the red line, while the low-expression group is expressed by the blue line. (d) Risk signature-based time-dependent ROC lines indicating 1-year, three-year, and five-year survival. (e) Correlation of the NPTX2 with T staging. (f) Correlation of the NPTX2 with N staging. (g) Correlation of the NPTX2 with M staging. (h) Correlation of the NPTX2 with clinical stage. (i) Correlation of the NPTX2 with grade. ∗p < 0.05 and ∗∗p < 0.01.
