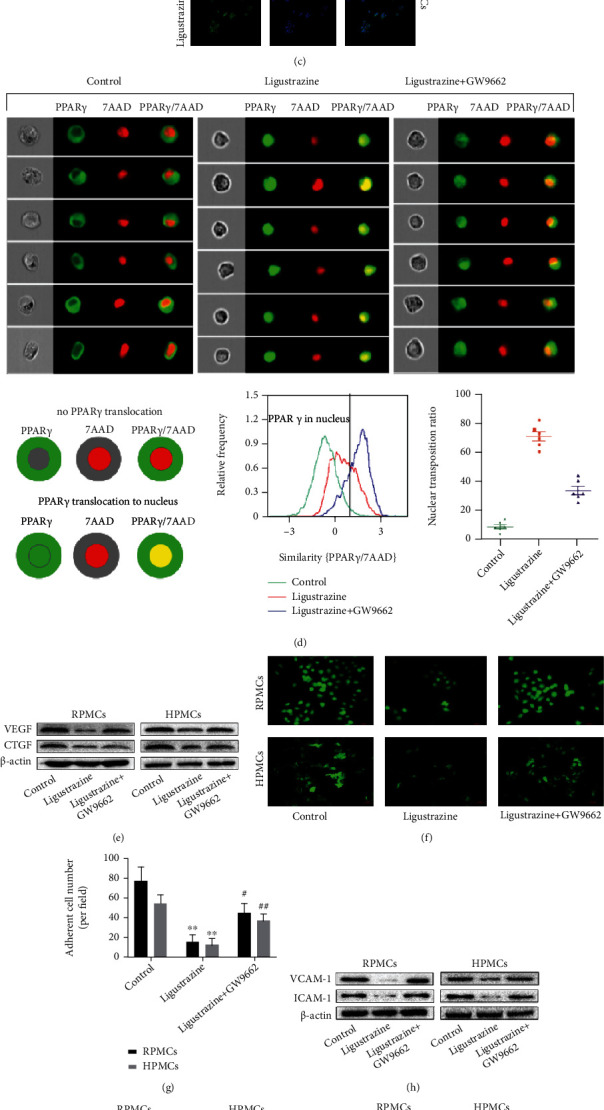
Figure 6.

Ligustrazine suppresses hypoxia-induced PMC functions by activating PPARγ. (a, b) Western blot and qRT-PCR analysis of PPARγ levels in hypoxia-induced PMCs treated with different concentrations of ligustrazine for 24 h. Compared with the control, ∗P < 0.05 and ∗∗P < 0.01. (c) Immunofluorescence analysis of PPARγ nuclear distribution in hypoxia-induced PMCs treated with 20 μM ligustrazine for 24 h (200x). (d) Flow cytometry analysis of PPARγ nuclear translocation in hypoxia-induced PMCs treated with 20 μM ligustrazine and/or 1 μM GW9662 for 24 h. (e) Western blot analysis of protein expression of profibrotic cytokines (VEGF and CTGF) in hypoxia-induced PMCs treated with 20 μM ligustrazine and/or 1 μM GW9662 for 24 h. (f, g) FDA staining assay of cell viability in hypoxia-induced PMCs treated with 20 μM ligustrazine and/or 1 μM GW9662 for 24 h (200x). Compared with the control, ∗P < 0.05 and ∗∗P < 0.01. Compared with the ligustrazine group, #P < 0.05 and ##P < 0.01. (h) Western blot analysis of protein expression of migration and adhesion-associated molecules (VCAM-1 and ICAM-1) in hypoxia-induced PMCs treated with 20 μM ligustrazine and/or 1 μM GW9662 for 24 h. (i) Western blot analysis of cytoskeleton protein (vinculin) expression in hypoxia-induced PMCs treated with 20 μM ligustrazine and/or 1 μM GW9662 for 24 h. (j) Western blot analysis of protein expression of FSP1 in hypoxia-induced PMCs treated with 20 μM ligustrazine and/or 1 μM GW9662 for 24 h. (k) Western blot analysis of protein expression of ECM-associated molecules (MMP2 and TIMP-1), mesothelial-related phenotypic biomarkers (E-cadherin and cytokeratin 18), and mesenchymal-related phenotypic biomarkers (Snail and α-SMA) in hypoxia-induced PMCs treated with 20 μM ligustrazine and/or 1 μM GW9662 for 24 h.
