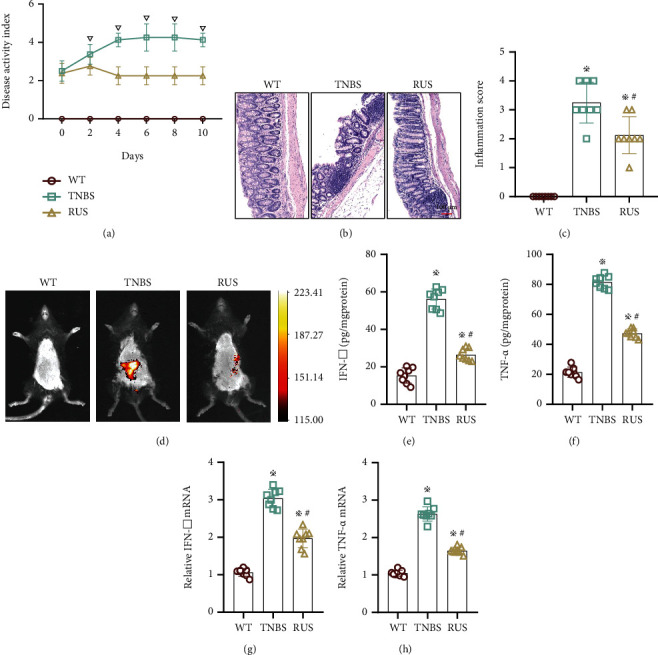
Figure 2.

RUS ameliorated TNBS-induced CD-like colitis. (a) The DAI scores of mice in the WT group, TNBS group, and RUS (1 mg) group; the DAI scores were determined using a 6-point (0-5) scale; each mouse was evaluated daily. (b) Hematoxylin and eosin (H&E) staining of colonic tissues in each group after 10 days of treatment. Inflammation areas are indicated by arrows. Magnified images are displayed in the lower left corner of the figure. (c) The inflammatory scores of intestinal tissues in each group after treatment. (d) The degree of inflammation in the mouse intestines as revealed by L-012 autoluminescent dye. (e, f) The protein levels of TNF-α and IFN-γ in colon tissues from each group. (g, h) The mRNA levels of cytokines in colon tissues from in each group. WT mice were divided into 3 groups: WT group, TNBS group, and RUS group. The experiments were repeated 3 times (n = 8), and the most representative result is shown. Data are presented as the means ± SD (※P < 0.05, compared with the WT group; #P < 0.05, compared with the TNBS group; ▽P < 0.05, compared with the RUS group).
