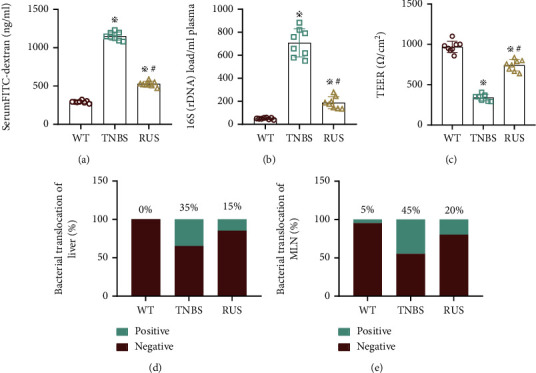
Figure 3.

RUS ameliorated TNBS-induced intestinal barrier dysfunction. (a) The serum levels of FITC in the WT group, TNBS group, and RUS group. (b) The abundance of serum flora in the WT group, TNBS group, and RUS group. (c) The TEER values of colon tissues in the WT group, TNBS group, and RUS group. (d, e) The rate of bacterial translocation in the MLN and liver as determined in cultured bacteria. These experiments were repeated 3 times (n = 8), and the most representative result is shown. The data are presented as the means ± SD (※P < 0.05, compared with the WT group; #P < 0.05, compared with the TNBS group).
