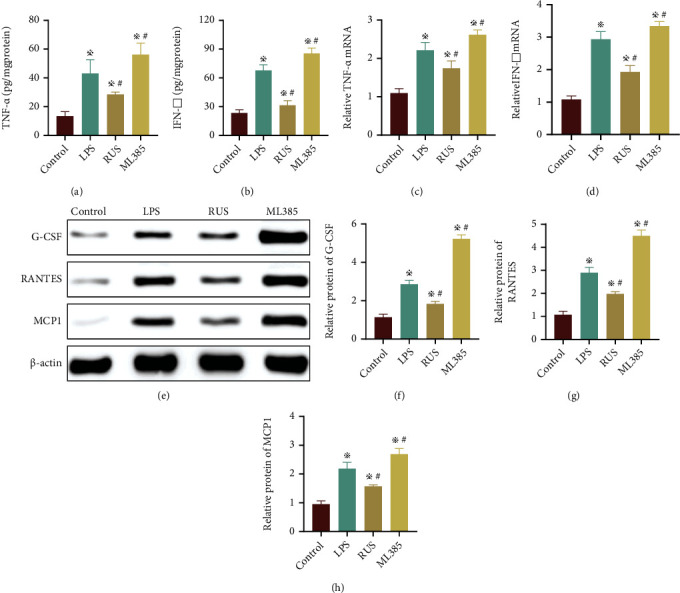
Figure 5.

RUS ameliorated inflammatory responses in intestinal epithelial cells. (a, b) The protein levels of TNF-α and IFN-γ in organoids collected from the control group, LPS group, RUS group, and ML385 group (with RUS). (c, d) The mRNA levels of cytokines in organoids collected from the control group, LPS group, RUS group, and ML385 group. (e–h) The protein levels of G-CSF, RANTES, and MCP1 in organoids from the control group, LPS group, RUS group, and ML385 group as determined by WB. The experiments were repeated 3 times (n = 8), and the most typical result is shown. Data are presented as the means ± SD (※P < 0.05, compared with the control group; #P < 0.05, compared with the LPS group).
